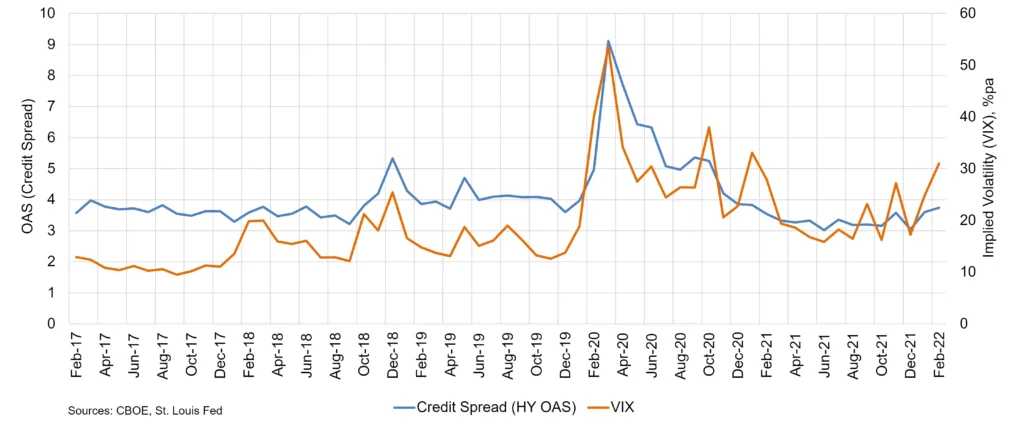
With East-West tensions running high and interest rates at an inflection point, market risk indicators are increasingly important. Equity markets focus on the VIX volatility index, bond markets on credit spreads. These measures are linked: equity market volatility is a classic model input for credit risk estimates. Rising share price volatility implies higher default risk in the Merton framework, so it should not be surprising if credit spreads show positive correlation with the VIX.
Option-based equity volatility is, however, only a proxy for company asset volatility; credit spreads may spike because of an increase in the credit risk premium, rather than an increase in the real-world probability of default. And despite some very synchronized spikes during the early phases of the Covid pandemic, these risk metrics still show plenty of scope for short-term divergences. But whether the market measures are correlated or divergent, Credit Benchmark’s consensus credit data1 provides a third datapoint, and a direct read on the real-world probability of default, independent of short-term noise in the equity and bond markets.
Figure 1 plots monthly time series for the VIX index (“VIX”) and the High Yield option-adjusted credit spread (“HY spreads”) since 2017; Figure 2 shows credit consensus metrics for the same period. The bars in Figure 2 plot changes in median default risk (from a universe of 800+ industry/sector aggregates), and the line shows interquartile range (“IQR”). The latter measures sector risk divergence using the 25th and 75th percentiles of credit risk changes across the aggregate universe.
Figure 1: VIX and Credit Spreads

Both metrics show small spikes in Q4 2018, and again in Q2 2019.
The Covid outbreak pushed both indicators to near-record highs and both have more than halved since then.
The VIX entered a rather erratic uptrend from mid-2021 onwards, and HY spreads have also recently been climbing.
Figure 2: Consensus credit risk estimates, across 800+ sector aggregates.
The IQR often spikes at the same time as the VIX and the HY spread, and the early 2020 Covid spike led to months of rising median default risk.
But the early 2021 risk recovery saw another IQR peak in June. In recent months, like the VIX and the High Yield spread, the range is trending slightly higher.
NB: The last two plotted points are provisional based on contributor flash updates.
The interquartile range is one of a family of indicators that may anticipate shifts in real world credit risk estimates. Crucially, it can spike when either positive or negative changes in default risk are on the horizon. When assessed against the VIX and credit spreads, it can confirm or deny the current market view, or alert investors to credit portfolio and default risk changes – positive and negative – that may not yet be picked up by the usual market metrics.
At a time when the global economy is grappling with supply chain problems, Fed tapering and international tension, current data show all three measures heading higher. The market price of risk may be rising, but it looks like major financial institutions see current problems translating directly into higher default rates.
Volatility is usually measured by the standard deviation family of metrics, mainly because of their tractability for option calculations and parametric VAR estimates. However, percentile-based metrics have the advantage that they are non-parametric and naturally include any asymmetry (ie skewness); They can also be used to compare different points on the distribution of credit risk changes (such as comparing the 95th percentile with the 50th).
As long as robust aggregates are available, any volatility or range based metric can be applied to specific regions or countries, or in global subsets of the aggregate universe that focus on one industry, sector, or credit portfolio. The data reviewed here suggest that it can also anticipate credit risk changes in loans and assets where VIX or spread metrics are unavailable.
The data used in these calculations can also be used to assess the cross-sectional correlation between credit risk changes from one time period to another. For example, if the monthly cross section correlation has been high and positive for several months, and then turns negative, it indicates that the pattern of credit risk is changing – with risk dropping after a spike in some sectors, and vice-versa in others. In effect it signals the end of a period of one-way trending in sector credit risk estimates.
To download this report in PDF, please complete your details:
[1] The consensus forward-looking credit views of major financial institutions covering more than 30,000 corporate and financial counterparts.
