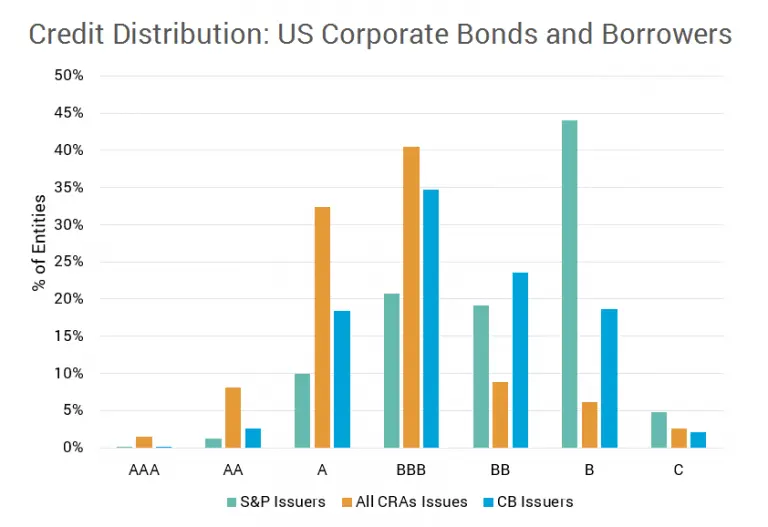
The large proportion of US Corporate debt in BBB bonds has raised concerns in the financial press that any economic weakness could see a significant proportion of these downgraded to Non-investment Grade. But bonds are only part of the Corporate debt picture; bank-sourced data shows the credit distribution of corporate borrowers that use bank financing, even if they are unrated by the main agencies and/or do not issue bonds. The chart shows major differences in the credit distribution of bonds compared with S&P issuer ratings and bank ratings of their own borrowers.

Source: S&P, Bloomberg, Citigroup, Credit Benchmark
In particular:
- There are high proportions of bonds in the A and BBB categories, and a relatively low proportion in the BB category.
- Relative to bonds, borrowers from banks show a much higher proportion in bb (equivalent to BB) and a significant number in the b category.
- S&P issuers have a very high proportion in the B category. This group seems to be under-represented in the US Corporate bond and bank borrower distributions.
This suggests that many of the B rated issuers are self-funding, or use peer-to-peer borrowing, and have more limited access to bond issuance or bank borrowing. Although the financial media has focused on BBB bonds, this data suggests that there is a large number of B-rated issuers that may be most at risk in any credit downturn.
