The 2022 technology stock meltdown brought widespread financial damage to Indices, ETFs, IPOs, VCs, cryptos and 401K plans. Markets are repricing the new reality of geopolitical tension, inflation and scarce money. But has the selloff brought opportunities?
Credit Benchmark Credit Consensus Ratings (CCRs) provide a unique angle; they are one step removed from volatile market values, reflecting balance sheet strength and the long-term robustness of business models.
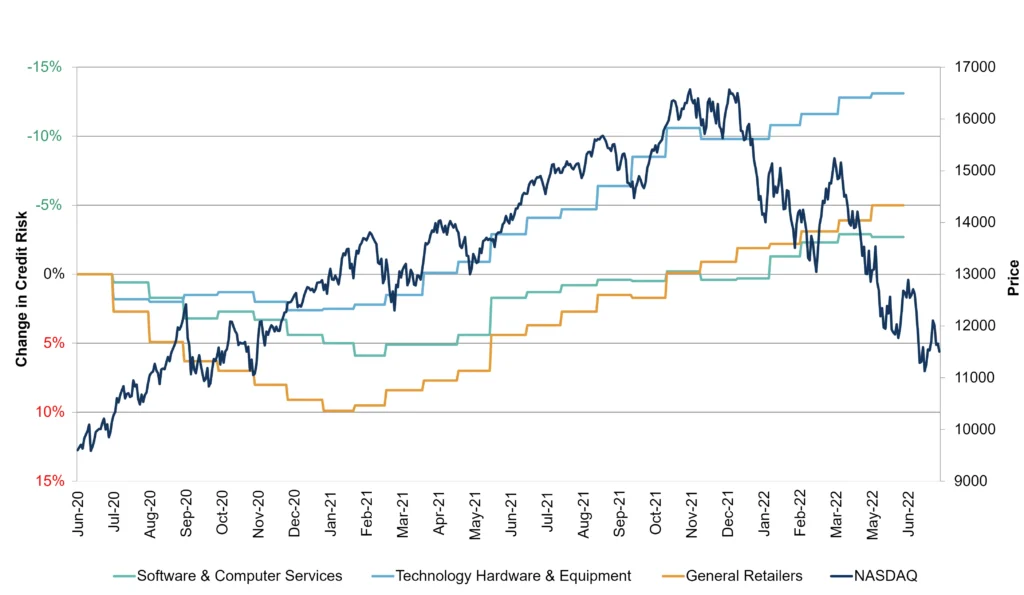
Figure 1 plots the NASDAQ over the past two years against credit risk movements for the aggregates that cover some of the major technology companies (Broadline Retailers, for example include Amazon and eBay).
Detailed consensus credit data is available on Bloomberg or via the CB Web App, covering many otherwise unrated companies. Contact Credit Benchmark to start a trial or to request a coverage check.
Figure 1: NASDAQ Equity Index and Credit Benchmark Technology Credit Trends

COVID was generally good for technology credit quality: after the initial limited downgrading, all three sectors have made a steady recovery. Hardware & Equipment shows a sustained improvement, even in recent months. This reflects the impact of WFH on demand for technology, and the explosion in online retail as a key household lifeline during early lockdown. Hybrid working is now the norm in many service industries, so the positive impact has persisted.
But equity price drops suggest tough times ahead. Supply chain issues have hobbled some product launches, and cash-strapped corporates are delaying hardware (and software) upgrades. Chip shortages are biting in many sectors; and this is not automatically good news for semiconductor manufacturers as material and energy costs spiral.
Funding for startups is drying up, and bond issues are becoming more expensive and less liquid. And households are cancelling streaming services with subscription fees are dropping in response, while non-essential subscription apps are not being renewed.
Share prices of the largest and best-known tech names have been severely hit, especially where earnings targets are missed or guidance has been downbeat.
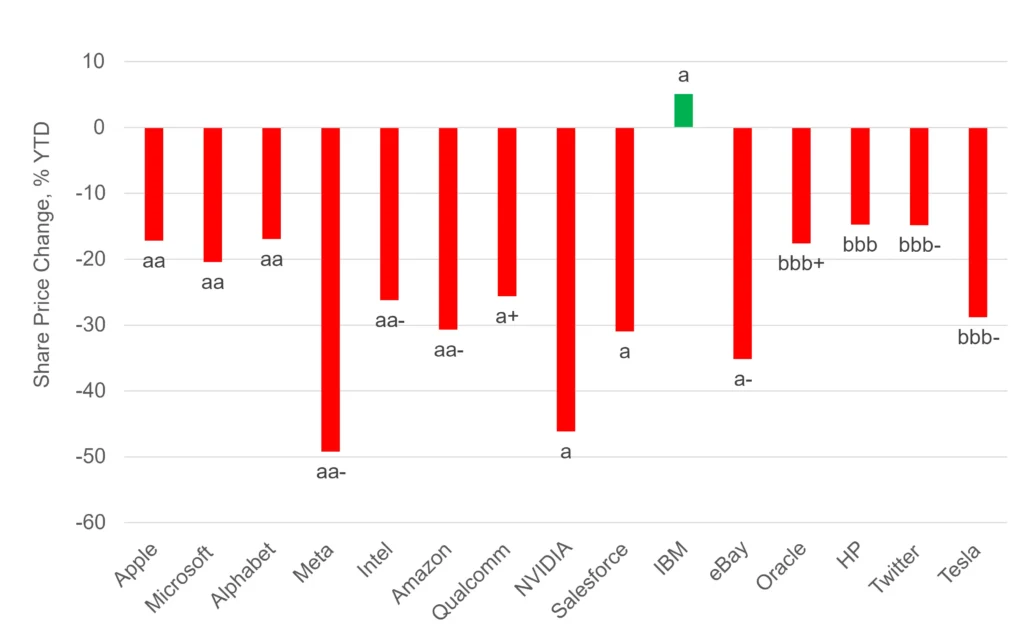
Figure 2 shows 15 of the main tech stocks across a range of subsectors (as of July 11th).
Figure 2: Main Technology Stocks: Equity Performance YTD and CCRs

Microsoft (aa) results have been healthy, but its share price is down more than 20%; whereas the IBM (a) share price is actually up this year. Apple (aa) – also down approx. 20% – has maintained earnings but warns of supply chain challenges ahead.
Amazon (aa-) is suffering as the WFH peak passes, and competition intensifies. Alphabet (i.e. Google) (aa) reports significant drops in YouTube advertising revenue – although the share price has tracked Apple and Microsoft.
Meta (aa-) also missed earnings while its share price dropped nearly 50%, although the decline in user numbers seems to have stabilized. Tesla (bbb-) faces headwinds of increased competition and supply chain issues, plus the legal fallout from its abandoned Twitter takeover. Ironically, the Twitter (bbb-) share price probably benefited from a bid during the worst of the tech stock decline.
The relative price divergence between chipmakers Intel (aa-), Qualcomm (a+) and NVIDIA (a) show the impact of the cryptowinter on NVIDIA’s business.
It is no surprise to see weakness in the Salesforce (a) share price during a business downturn, but eBay (a-) is less predictable: more households are selling their junk to raise some cash, but they need buyers – and eBay report that overall revenues are down.
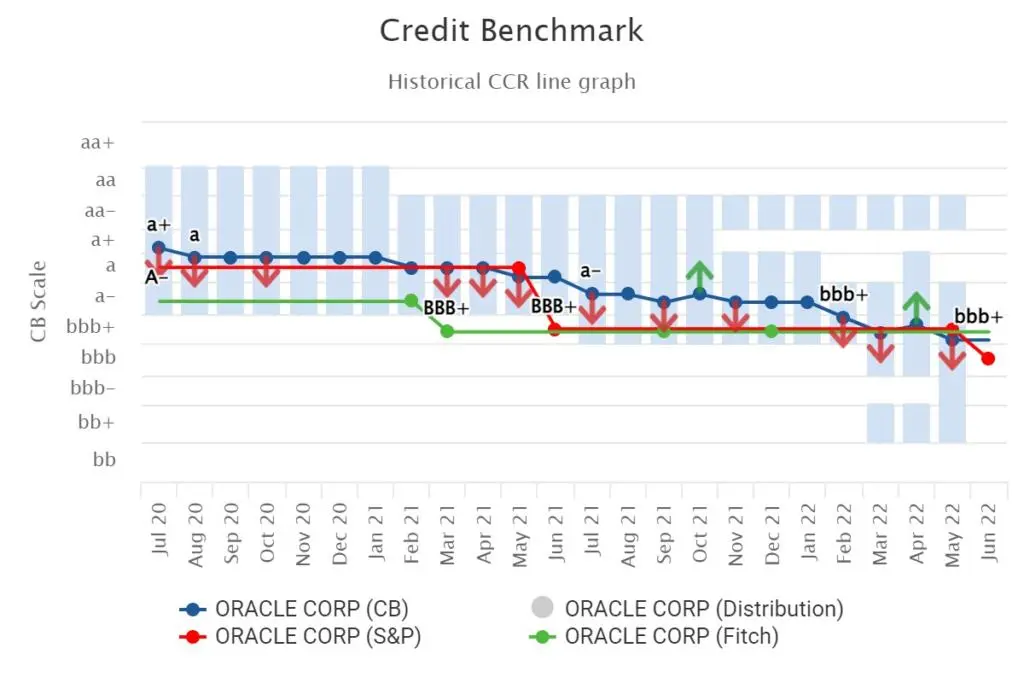
HP (bbb) and Oracle (bbb+) shareprices have been relatively stable, but the Oracle credit consensus rating has downgraded from a+ to bbb+ in the past 2 years. Figure 3 shows the detailed credit trend for Oracle Corp.
Figure 3: Oracle Corporation

So are there opportunities in the technology sector? Some of the “boring” tech companies are amongst the strongest credit ratings and best performers, but others have lagged, perhaps unfairly. And some of the weaker credits have avoided the worst of the tech rout.
Enjoyed this report? If you’d like to see more consensus-based credit ratings, mid-point probabilities of default and detailed analytics on 60,000+ public and private global entities, please complete your details to start a trial or to request a coverage check:
