
The US has announced measures to protect the Steel and Aluminium sectors in the US. If implemented, the policy will impose tariffs of 25% (Steel) and 10% (Aluminium) on imports into the US, without exceptions.
This is good news for the domestic metal producers, but potentially bad news for US manufacturers who are heavy importers of either metal – such as Boeing, Ford, Caterpillar, Anheuser-Busch and MillerCoors.
These companies will benefit from recent tax cuts and other domestic economic policies, but tariffs will squeeze their margins unless they are able to fully substitute in favour of domestic metal supplies. This will be less onerous for the Steel companies (who import about 30% of raw metal) than for the Aluminium companies (who import 90%).
The EU is now threatening to retaliate by imposing a range of import tariffs, including those on US auto imports. There are now significant concerns about a full blown and multilateral trade war.
Aggressive price competition is, in the short term, damaging for all participants, and not just those directly involved in trade – tariff hikes push up costs across the supply chain. In the longer term, the relative winners of a trade war will be those who have the strongest financial reserves. As a proxy for this, this note compares the credit distribution of US and EU Corporates.
Exhibit 1 shows the distribution of US and EU (ex-UK) Corporates according to their Credit Benchmark Consensus (“CBC*”) ratings.
Exhibit 1: Comparison of Corporate credit distribution – US vs EU (ex-UK)
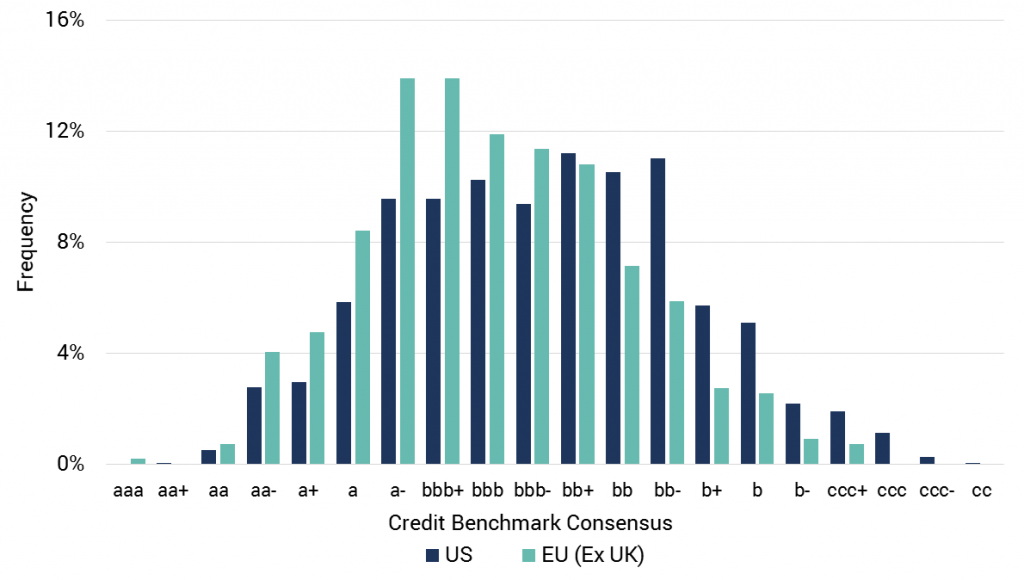
Source: Credit Benchmark. US sample = 2374 Corporates, EU (ex UK) sample = 546 Corporates
This shows that, based on the bank-sourced data sample, the typical EU (ex-UK) Corporate has higher credit quality than the typical US Corporate.
Based on a weighted average CBC, the typical EU Corporate is at the lower end of Investment Grade and the typical US Corporate is just below Investment Grade.
This suggests that EU Corporates are in a stronger financial position in the event of a broad trade war; but it also shows that, in credit terms, they have most to lose.
*Credit Benchmark Consensus (“CBC”): this is a 21-category alphanumeric scale based on bank-sourced one-year probability of default estimates. It is similar to the scale used by the main credit rating agencies, so that a CBC of bbb is approximately equivalent to BBB reported by S&P and Fitch, and Baa2 reported by Moody’s
.

