In the newly published special report from Structured Credit Investor (SCI), Mark Faulkner, co-founder, Credit Benchmark, investigates how Credit Consensus data can help support growth in SRT activity. The full report, “Global Risk Transfer Report 2022: Expanding the Universe” can be accessed for free here.
In times of flux, prudent risk management is of critical importance. After a stretch of relative calm in the world of credit risk, a stronger focus on risk management is crystallising across the capital markets, including in the business of significant risk transfer (SRT).
This change is being driven by a combination of distressing geopolitical and macroeconomic events. After the initial shock, the coordinated accommodative economic policy driven by central bankers in response to the global pandemic created conditions for a relatively ‘benign’ credit environment. These conditions have proven to be the lull before the storm.
The scale of the unprecedented action by central banks protected much of the global economy and companies from default. However, as liquidity and fiscal support are now inevitably being withdrawn, we find ourselves adjusting to a ‘new normal’; positioned at the epicentre of a dramatic economic storm.
Rising inflation, interest rates and ongoing supply chain challenges are having a major impact upon all aspects of the economy and are inevitably concerning to investors. In this increasingly ‘malign’ environment, analytically and empirically grounded composure is an invaluable asset.
Over recent years, SRT transactions have grown in popularity as banks look to release and redeploy regulatory capital, with investors happy to take on the higher returns of bank-owned high-yield assets. Banking business models are increasingly factoring in the ability to originate and distribute risk to investors via strategic risk-sharing programmes. This growth is likely to continue, given current market conditions, and should be supported by appropriate risk-related data to ensure the sector can operate efficiently and at scale.
It is clear that investors are seeking a higher level of informational transparency than that currently available as standard. This is in response to the changing market conditions and to ensure that they invest in portfolios that reflect their particular risk/return profile.
This case study explores some themes around how data can optimise portfolio construction now and in the future. The recent Credit Benchmark whitepaper, ‘Credit Consensus Ratings and Risk Sharing Portfolios’, provides a more in-depth technical analysis.
Risk versus reward
“Not all portfolios are equal; it is important to know the underlying risk and get paid accordingly” – an experienced SRT investor
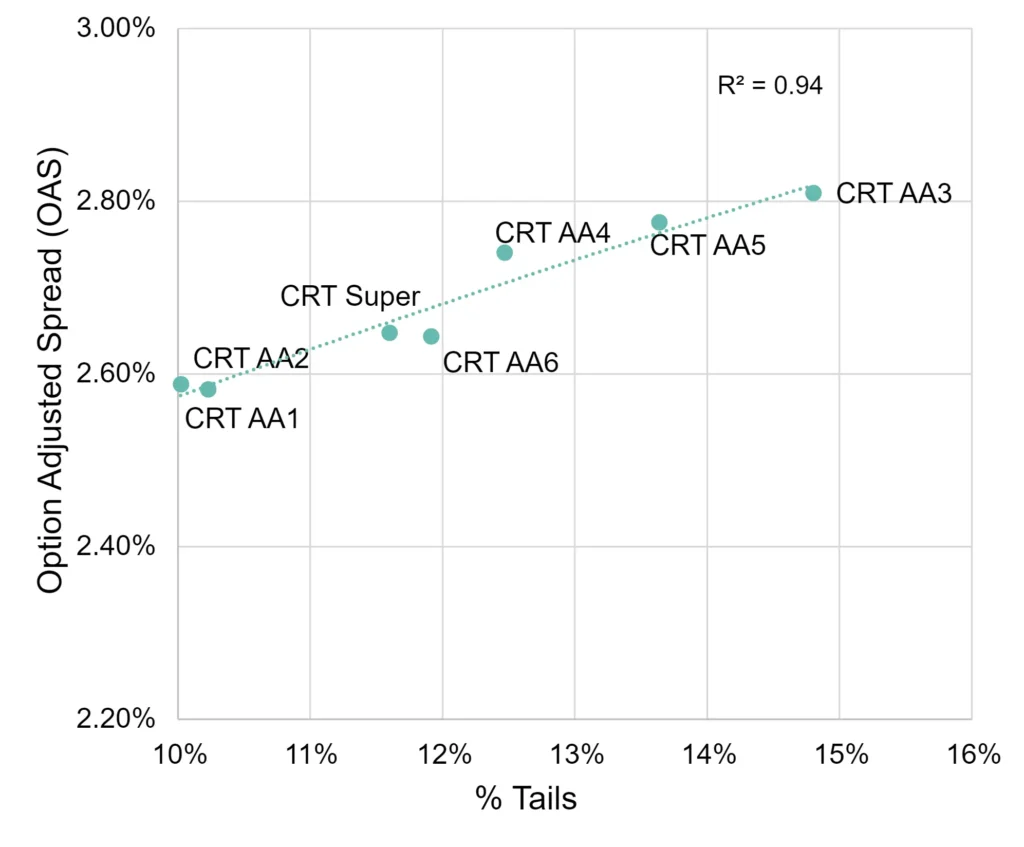
Figure 1: Option Adjusted Bond Spreads (Proxy for PIT) vs Tail Risks for 7 sample portfolios
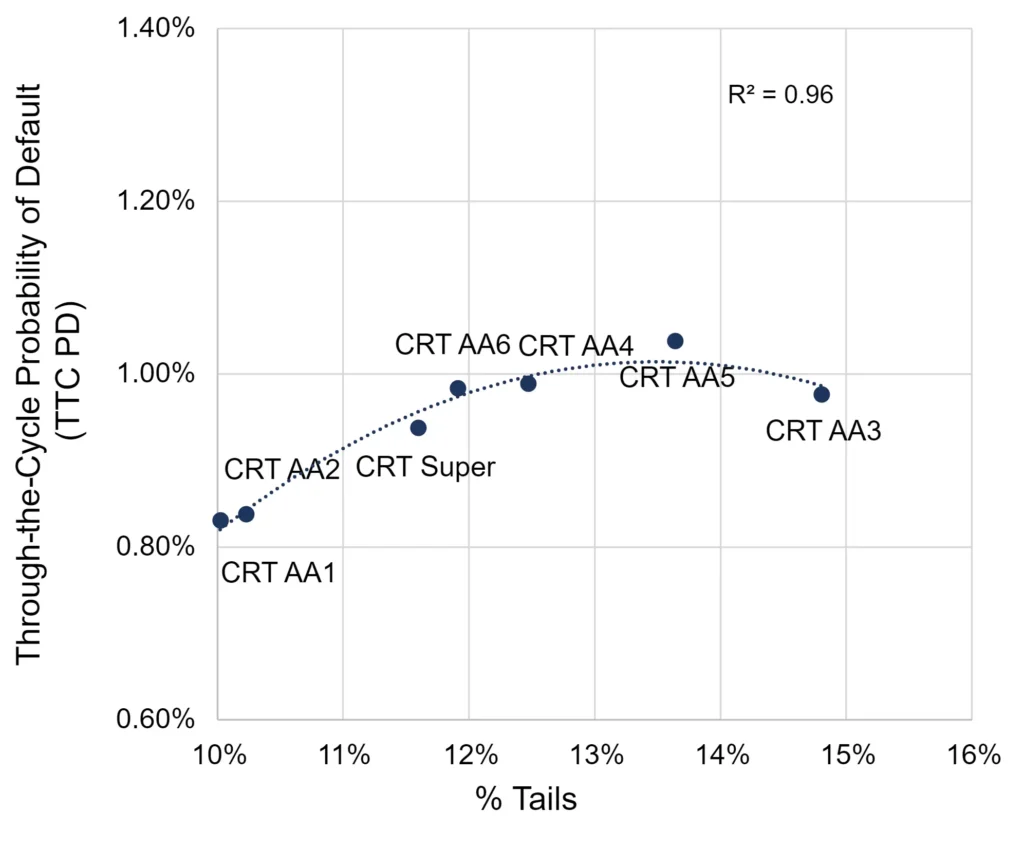
Figure 2: Through-The-Cycle Probability of Default (TTC PD) vs Tail Risks for 7 sample portfolios


Risk is measured here by the proportion of exposures in the ‘tail’ of b- and c-rated credits – just one of a range of portfolio risk measures that can be used. Investors need at a minimum to cover credit risk, so the lowest acceptable return for each portfolio can be proxied by real world probabilities of default (PD). The upper pricing bound will be closer to market-implied PDs embedded in Option Adjusted Spreads (OAS). The latter also include a risk premium and will be more sensitive to short-term credit cycles.
Observations on the sample CRT portfolios above:
- In general, higher tail risk brings higher compensating return, especially when tail risk is compared with OAS.
- For some actual CRT portfolios plotted here, the lower pricing bound (measured by PD) does not compensate for higher tail risk; e.g., Portfolio AA3. So, if tail risk is a particular issue – such as during a period of rising defaults – then deal pricing based on average PD will probably not fully compensate for tail risk.
Investors in the world of SRT are a diverse group, ranging from sovereign wealth funds to hedge funds and all types of asset managers in between, and this diversity lends strength to the market. The ability to identify portfolios that meet these diverse needs and to monitor their changing risk profiles is essential to reassure investors, especially for new market entrants.
“As a new investor in the SRT sector, we need reassurance from issuers and elsewhere that we are making sound investments at these challenging times” – a prospective sovereign wealth SRT investor
Credit risk information is valuable at the initiation of a transaction and throughout its lifecycle, to support both portfolio construction and ongoing portfolio monitoring and surveillance. Other enhancements – such as the ability to receive automated alerts when portfolio risk changes – can only serve to improve risk management practices in the SRT business.
However, issuer-provided data is not always easy to come by in certain jurisdictions and in certain segments of the market. Where transparency is lacking, aggregated data at a sectoral or geographical level can supplement entity-level ratings. For both disclosed and undisclosed portfolios, the ability to complement issuer-provided information with a richer source of externally available data is likely to become standard market practice.
Portfolio diversification impacts risk and return
Depending on which assets you invest in, there is a big difference in how much diversification you are getting in a portfolio. Even within the context of mid- to large-cap corporate portfolios, true diversification can be difficult to measure and monitor.
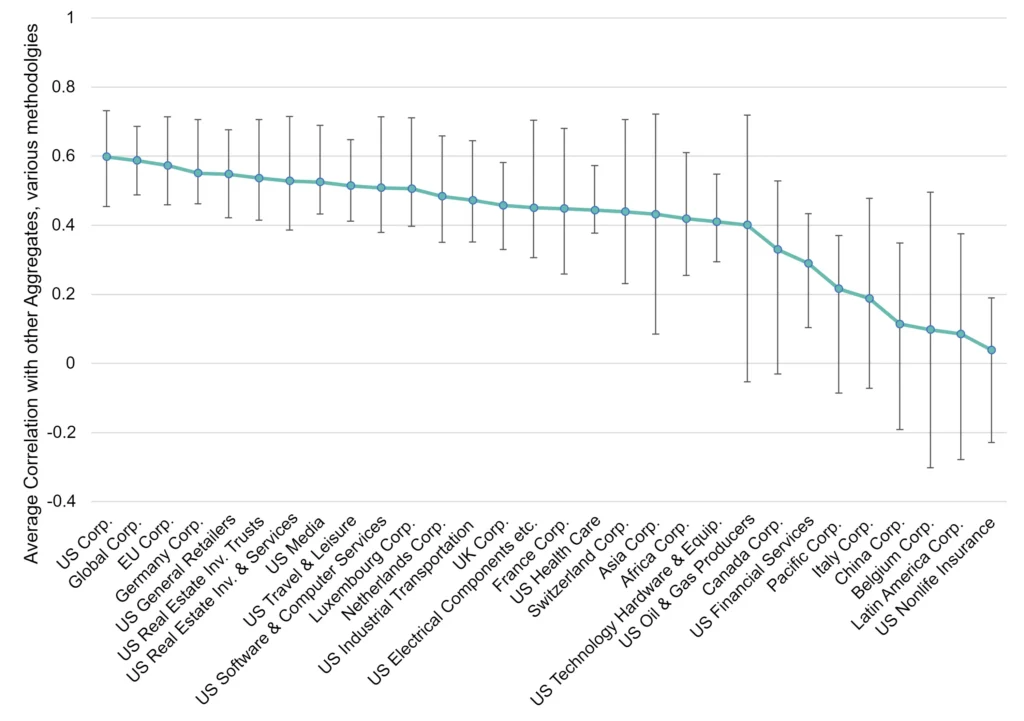
Figure 3 shows the range of credit risk correlation estimates across a sample of 29 sector aggregates. In effect, this shows whether a particular sector will remain stable when other sectors are experiencing deterioration. Some sectors show very similar credit risk profiles in all market conditions; others may be independent or even negatively correlated.
Figure 3: Most and Least Diversifying – 30 Sector Aggregates Used for Portfolio Examples

There are many ways to estimate sector similarity – they all involve a correlation estimate, but these can be based on similarities in PD changes, in ‘tails’ (% of an asset class in the b and c credit categories over time) or on market risk measures, such as OAS. The error bars in the chart show the range of estimates using different measures of correlation – for some sectors, such as the ‘catch-all’ aggregate ‘Global Corporates’ (second from left), the range is very narrow – most measures give similar results. For others – such as ‘Belgian Corporates’ – the range is very large, while the average correlation measure is low. So Belgian corporates may look like a way of diversifying a portfolio, but there is a lot of uncertainty about their behaviour across the credit cycle.
Alternative sources of correlation estimates are patchy – CDS indices cover a limited range of names and many of them are illiquid; OAS are more widely available but restricted to traded bond assets subject to the short-term swings in market sentiment and credit/liquidity risk premiums. They also tend to be positive and high – close to a value of +1 (implying perfect correlation) – in all but the most unusual market conditions.
By contrast, Credit Consensus data provides a set of regular and consistent time series, including risk estimates for legal entities that are not publicly traded. They are also stable over short periods, while showing trends and turning points over longer time periods.
Correlation matrices may also be used in various portfolio risk calculations and re-estimated for different time periods to assess their stability. These are likely to be utilised more widely as credit becomes more volatile.
What kind of information will support and assist the growth of the SRT business?
“Our bank is eager to provide useful and necessary information to investors – but we are wary of the cost of meeting the continuous demands for more and more information. Such provision can be expensive and of questionable utility” – a seasoned bank issuer
As the SRT market grows, additional credit intelligence can only be a good thing, benefiting banks and investors alike and helping to build and maintain confidence in the asset class. Recognising complementary sources of data that maintain necessary levels of confidentiality could ensure that risk sharing continues to function smoothly.
Diversity of portfolios and varying levels of regulatory-approved issuer disclosure implies a need in the industry for any available data to be contextualised, comparable and consistent. Standardisation or achievable industry-wide protocols could help, but establishing these presents a challenge – though one not beyond the wit of this innovative growing market, and with the potential for great benefits.
The provision of information from issuer to investor is not without cost to the former. To maintain the dynamism of the industry, it is important that this provision is not too onerous to banks, nor is it requested by investors for information’s sake. Alternative sources of data could ease this informational burden between parties.
As the pace of change in global markets accelerates, transition matrices may be more widely adopted to project PD term structures and future default rates for SRT portfolios. Additionally, overlaying point-in-time (PIT) data upon through-the-cycle (TTC) data could help investors make better informed decisions that consider current and expected market conditions amid increased risk volatility.
“It is a capital mistake to theorise before one has data” – Sherlock Holmes
The widespread adoption of appropriate levels of data provision will ensure the continued future growth of this increasingly important market. These are challenging times and the need to avoid surprises is essential. A greater understanding of the risk/return profile of a portfolio from inception to maturity can only be a positive force for all SRT practitioners.
Enjoyed this report? If you’d like to see more consensus-based credit ratings, mid-point probabilities of default and detailed analytics on 60,000+ public and private global entities, please complete your details to start a trial or to request a coverage check:
