2017 is likely to be a year of fiscal expansion across a number of developed economies. Low interest rates are losing effectiveness in a growing number of economies and the Fed may resume its rate rises this week.
But the ECB package announced last week shows that some Central Banks still see a role for monetary stimulus. And with the Italian Treasury prepared to recapitalize Banca Monte dei Paschi if their proposed capital raising falls through, it is clear that some European Sovereign governments are still prepared to act as lenders of last resort.
Whether it is tax cuts, spending, higher rates or direct intervention, it appears that Governments will continue to carry a major and often growing debt burden.
By contrast, the corporate sector is flush with cash having taken advantage of prolonged low interest rates to lock in long dated funding. While some companies are making large corporate acquisitions, most of the proceeds are held as cash. Corporates in Europe, US and Japan collectively hold at least $6trn in short term instruments.
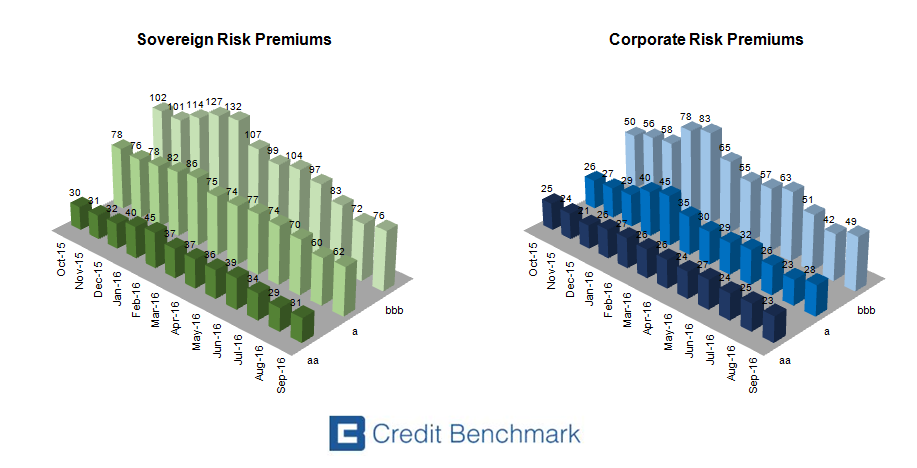
As a result of these trends, the credit position of these two classes of obligors – Governments and Sovereigns – is somewhat different. The charts below show monthly risk premiums for the year to September 2016 for the investment grade obligors in each of these two groups, divided by CBC*.
The risk premium is estimated by comparing the current market CDS price with the synthetic equivalent calculated from real world PDs and LGDs. The difference consists of short term credit risk and liquidity risk premiums. These charts show that credit and liquidity risk are systematically higher in lower credit categories, and also show that risk premiums have been following smooth cyclical trends.
These charts also show that Sovereign risk premiums are significantly higher than Corporate risk premiums in equivalent credit categories. This confirms that Sovereigns are currently viewed as higher risk, but the gap is closing. The charts also show that the current trend for both groups is down. If this continues, it implies that the outlook for credit risk in investment grade obligors – Government and Corporate – is improving.
These risk premium charts can also be used to track the credit cycle in different geographies and industries – we will provide further updates in 2017.
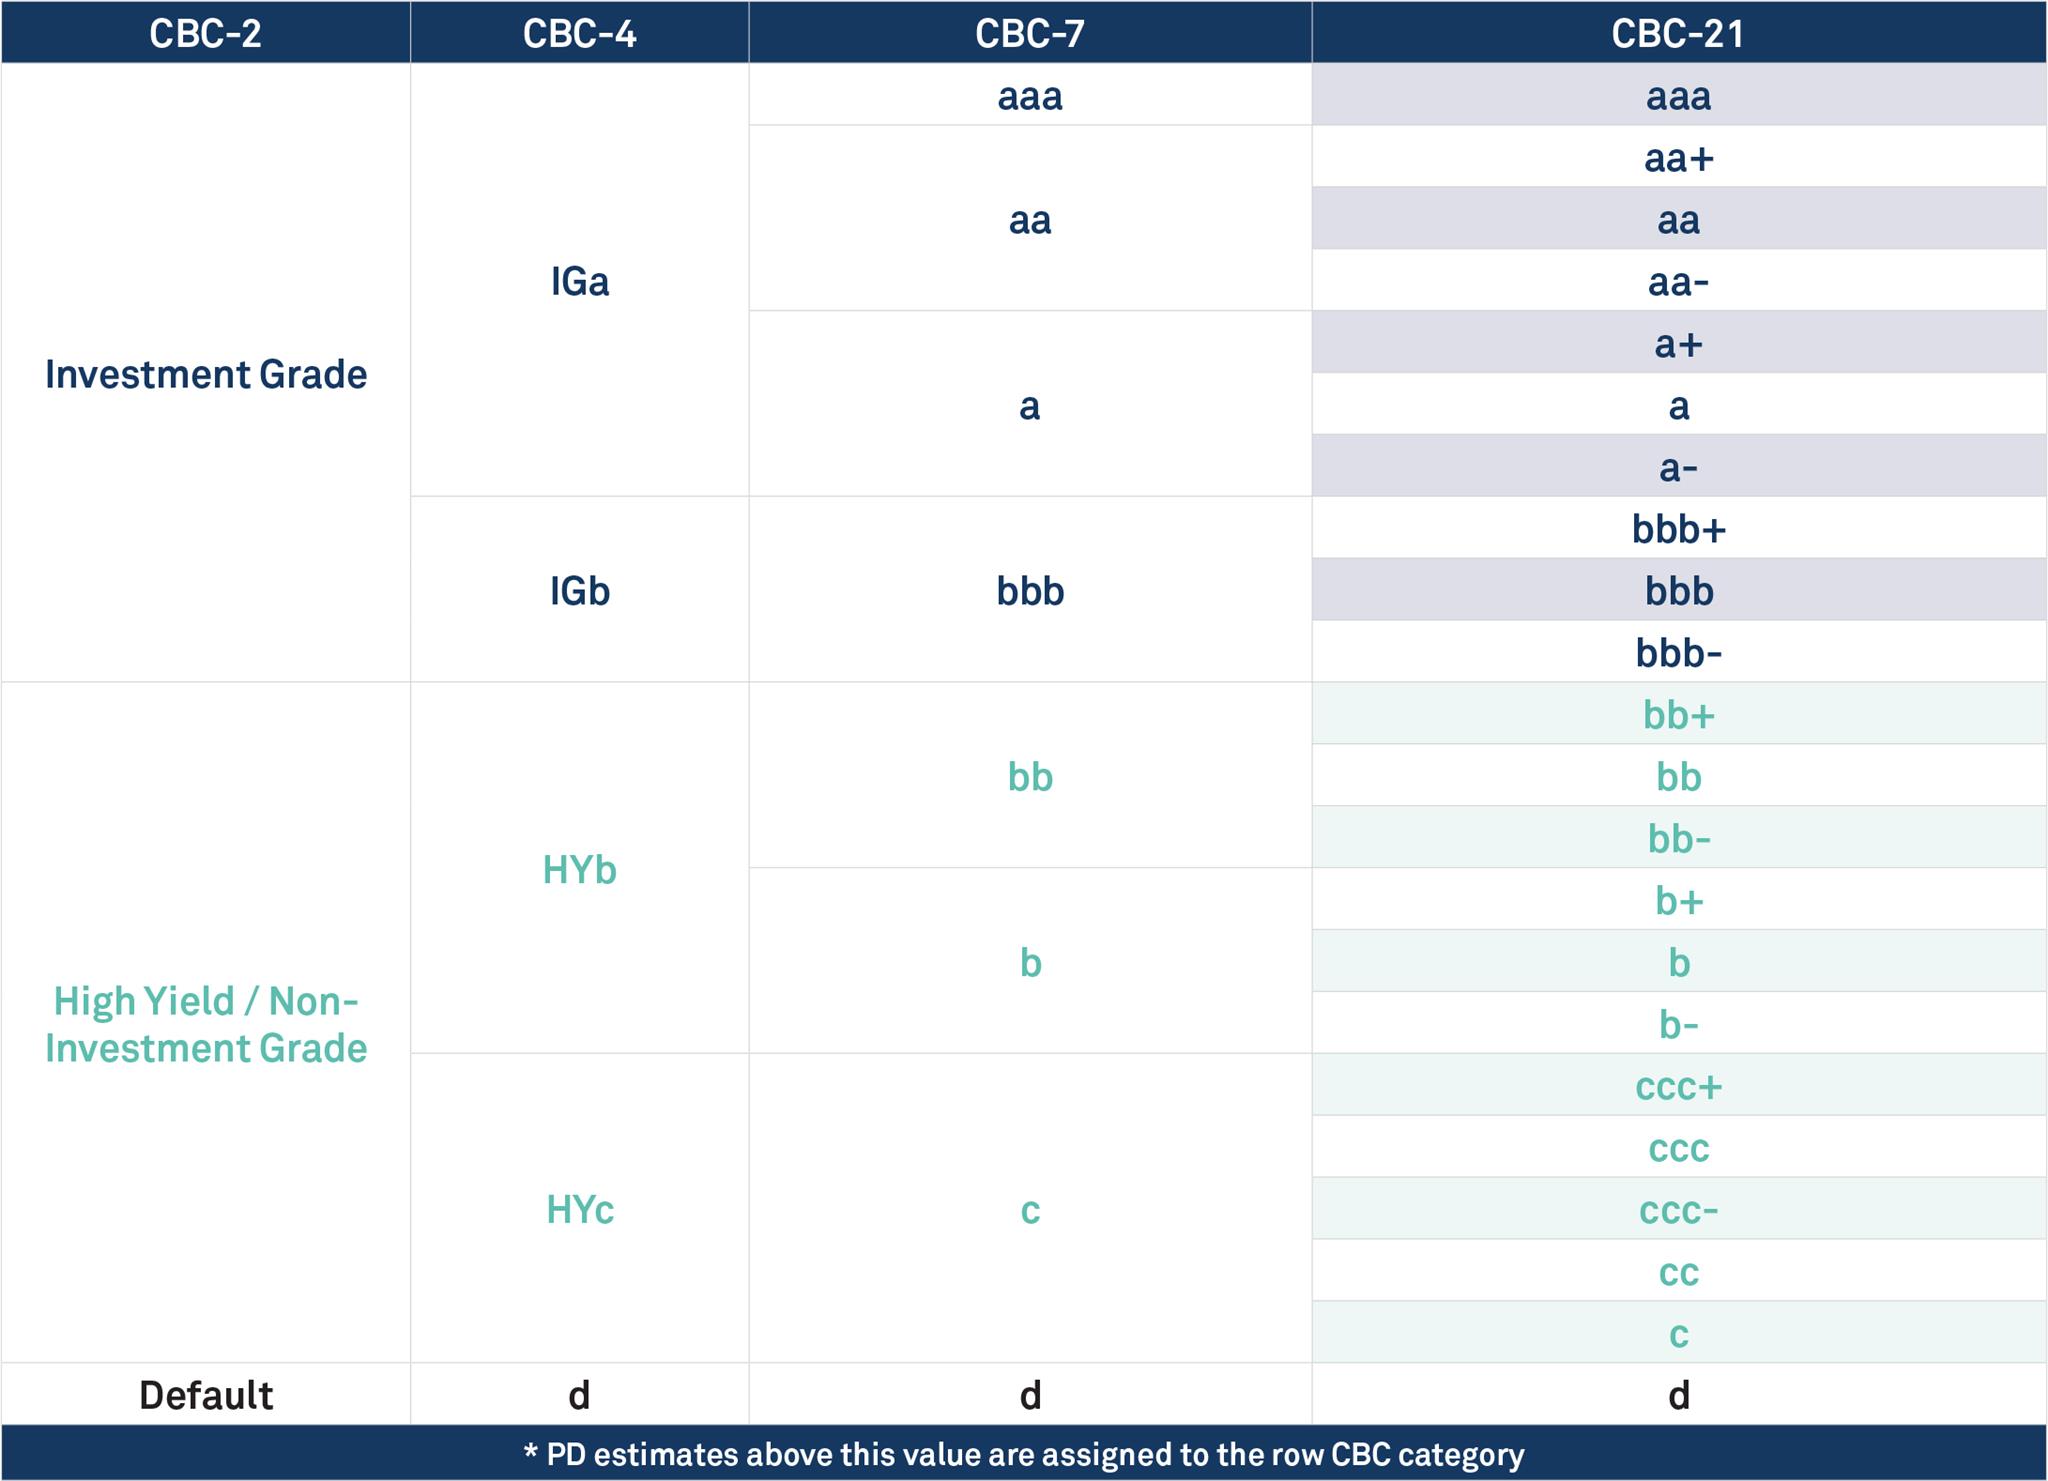
*CBC = Credit Benchmark Consensus; a 21-category scale which is explicitly linked to probability of default estimates sourced from major banks. A CBC of bbb+ is broadly comparable with BBB+ from S&P and Fitch or Baa1 from Moody’s.

