
Benchmarking SRT transactions and managing risk with consensus credit data
The SRT market is large, growing, and complex. The outstanding global value of the Significant Risk Transfer (SRT) market is about $80bn, and loans linked to these transactions between banks and investors has reached about $1trn. The market has grown by more than 30% in the past 12 months, boosted by the 2023 Fed ruling on credit-linked notes, and likely to accelerate this year if US banking regulations are eased.
In a typical bilateral SRT, the bank retains the senior tranche (80%-95%) of the reference portfolio and may also cover the small “expected” loss junior tranche. Investors become protection sellers, covering “unexpected” losses via an eligible credit derivative. The reference portfolio may cover multiple geography, industry and credit categories. Pricing across these multiple dimensions can be challenging, especially when the reference portfolio includes undisclosed obligors.
This note describes how investors are leveraging Credit Benchmark’s bank-sourced default risk estimates to evaluate these transactions, manage portfolio risk and optimize swap structures.
Credit Benchmark collects, aggregates and anonymizes the internal risk ratings and associated probabilities of default from over 40 financial institutions globally, over half of which are Global Systemically Important Banks (GSIBs). The resulting Credit Consensus Ratings (CCRs) cover more than 110,000 obligors and are used to create more than 3,000 custom indices across various geographies, industries and credit categories. CCRs have several unique advantages:
- They are based on bank analyst model-driven estimates of default risk, so are directly applicable to risk-sharing transactions initiated by banks.
-
For investors, CCRs enhance transparency and efficiency[1] in the SRT market.
- CCRs cover many obligors unrated by the main credit rating agencies that are often included in SRT transactions. This includes SMEs and private companies.
SRT transactions often blend disclosed and undisclosed portfolios. In the current market, this blend, and the overall geographic and industry composition of deals offered by banks is largely non-negotiable. However, a growing number of investors use CCRs to make informed pricing decisions and overall risk/reward assessments before agreeing to any deals. And for undisclosed obligors, investors can use custom indices, credit transition matrices, and sector correlations provided by Credit Benchmark to gauge the likely range of associated risks represented by that portion of an SRT transaction.
Portfolio Risk Management Based on Projected Default Rates
CCRs can be used to model portfolios directly with single name analytics, or indirectly with appropriate indices or proxies. The accuracy of proxies can be assessed by screening multiple criteria. These are outlined as follows:
Q1) What are the portfolio characteristics?
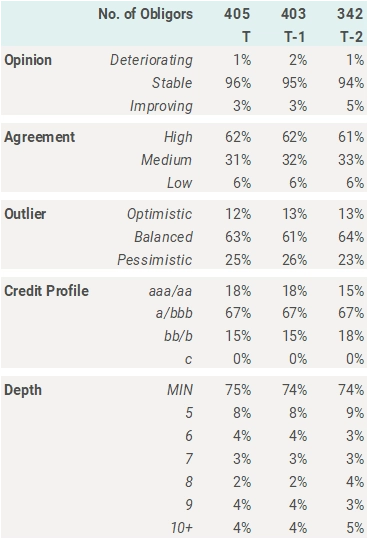
This table summarizes credit characteristics of a sub-investment grade portfolio for 3 recent monthly snapshots.
The “Opinion” section shows that more than 90% of the portfolio shows no change in CCR over the past month; and Improvements currently outnumber Deteriorations.
The “Agreement” section shows that bank opinions are broadly aligned for more than 90% of the portfolio, so managers can focus due diligence on the 7%-8% where there is more uncertainty.
The “Outlier” section shows that 20% of the portfolio names include some very skewed opinions. In each of these cases, of the banks that provide estimates for that name, one bank probably has a very pessimistic view.
The “Credit Profile” section shows a slight recent improvement in credit quality, with most obligors in the bb category.
The “Depth” section shows that more than 80% of obligors are borrowing from fewer than 5 banks, and this has increased slightly in the past 2 months. This can be used to track if banks are shifting loan exposures between specific sectors.
Q2) How could the portfolio credit profile change?
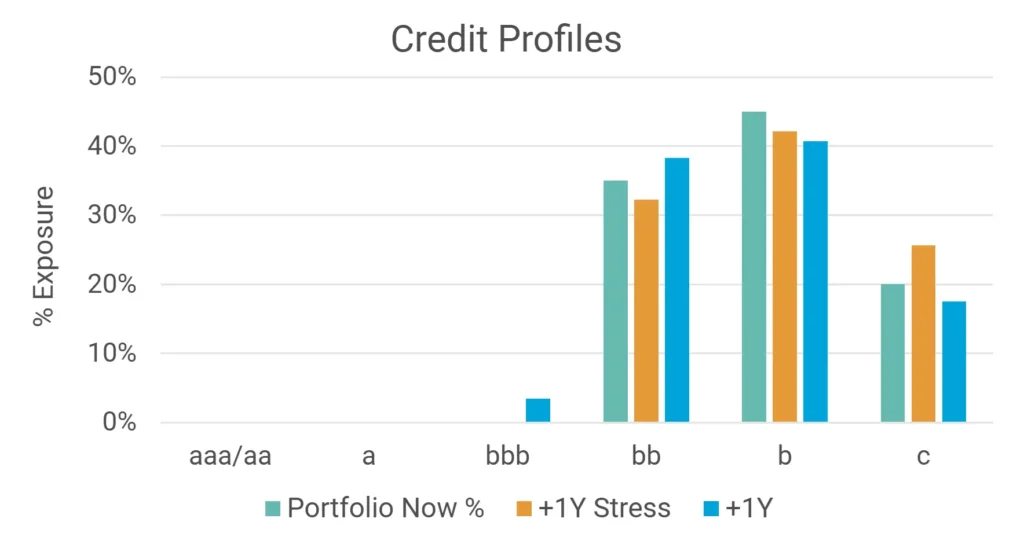
This chart shows how a high yield portfolio can change over time due to transitions. The blue bars show the likely profile after 1 year of typical transitions; the orange bars show the profile after a year of “stress” transitions – in this case modelled on credit behaviour during a credit downturn
With credit cycle data derived from CCRs, it is possible to manufacture a large range of transition matrices appropriate to the current stage of the credit cycle.
Q3) What is the likely impact of undisclosed segments?
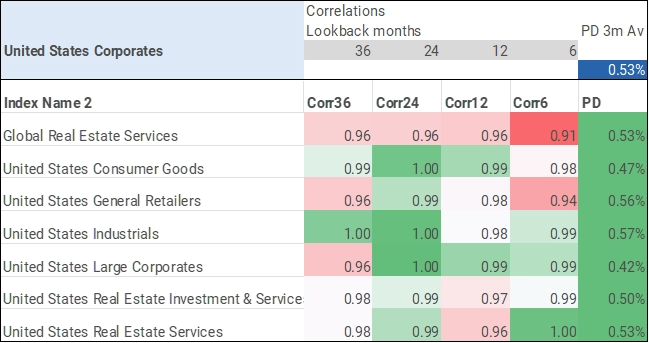
This table shows screening results derived from a large initial universe of Credit Benchmark’s consensus credit indices.
The criteria in this example are that there should be high correlations with US Corporates over 36,24,12 and 6 months correlation with US Corporates; and the index average PD should be between 40Bps and 60Bps.
This yields 7 major indices that meet all these criteria, alerting both parties in the deal to alternative “proxy” segments.
Q4) How is credit quality trending across the credit spectrum?
A challenge with tranched investments is divergence between credit classes. This is mainly driven by the first loss characteristics of each tranche, but it may also reflect a general divergence between “Risk On” and “Risk Off”.
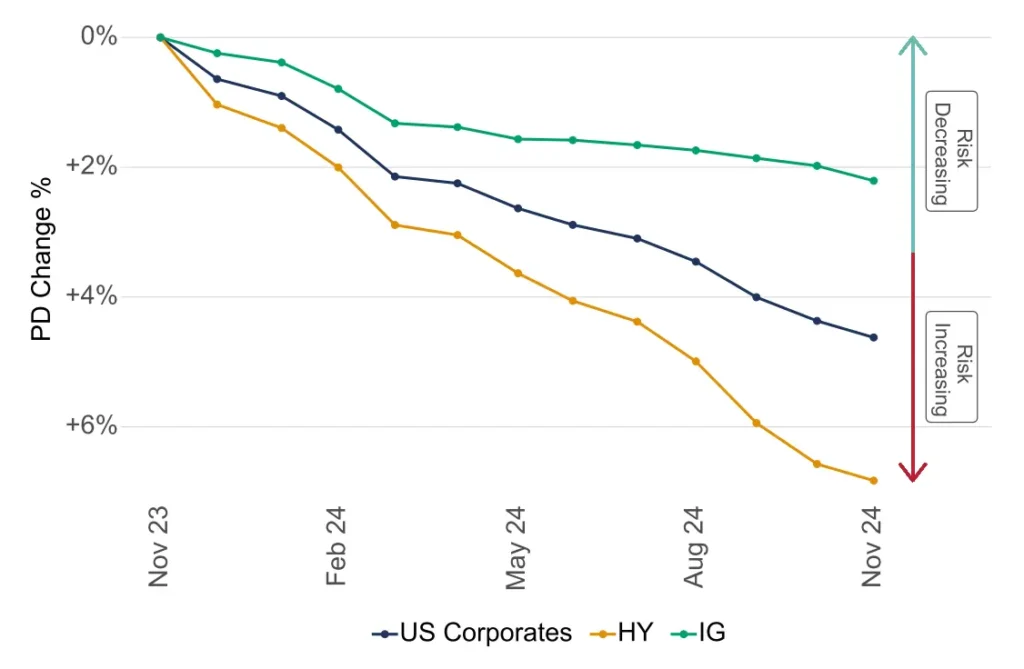
This chart shows the recent trends for Credit Benchmark’s US Corporates credit index, split between Investment Grade and High Yield. HY has deteriorated by 6% in the past year, against 2% for IG.
Investment Grade vs High Yield analysis across a wide range of sectors and geographies can be accessed via Credit Risk IQ, a repository of 10,000+ monthly industry reports.
Q5) What other metrics are available?
Credit Benchmark’s credit consensus data includes thousands of credit indices, used by banks and investors to track correlations between Probability of Default (PD) changes, divergences in PD levels, and credit upgrade/downgrade behaviour[2].
Credit profiles (% in bb, b, and c) give some indication of the range of PD estimates within each index; investors can compare the profile of their own portfolio with that of the relevant index for a specific sector. They can also compare their own rating estimates with bank views.
Conclusion
Within the SRT segment, single borrower CCRs give investors an unbiased snapshot of the inbound portfolio. Investors can compare credit distributions for current and proposed portfolios, either in their own credit scales or in classic 21-category format for comparison with external quotes. CCRs can also be used for monitoring of the collected portfolio.
Banks can leverage similar analysis based on detailed CCRs, but without the need to divulge their individual entity ratings. Comparative credit distributions allow them to demonstrate the efficacy of their underwriting standards.
For undisclosed transactions, banks can demonstrate how internal pool ratings compare with the market, again without divulging either entity-specific detail or ratings linked to specific entities, providing a clear and tangible quantification of the efficacy of bank underwriting standards.
Credit Benchmark’s consensus indices provide a rich set of metrics for tracking trends, divergences and proxies.
The rich consensus dataset also supports ongoing portfolio monitoring, servicing and substitutions. Detailed CCRs allow investors to assess marginal changes to risk through additional transactions. For banks who provide ongoing portfolio / trade reporting, consensus data is an independent and regularly updated reference point covering the portfolio lifecycle from trade inception onwards.
Credit Benchmark can run matching algorithms on client deal tapes to reconcile borrowers with our own internal identifiers, normalising for different schemas across multiple deal tapes from different lenders. Bespoke analysis available to clients includes providing deal tape risk governance reports with specific metrics aligned with the borrower’s risk management approach.
Contact us at [email protected] to learn more about our SRT solutions or to request a demo.
Credit Benchmark consensus credit data is updated twice-monthly and delivered to our clients via our Web App, Excel add-in, flat-file download and third party channels including Bloomberg. Advanced analytics like those found within this report are now also available for free on the Credit Benchmark website via Credit Risk IQ. 10,000+ monthly geography-, industry- and sector-specific risk reports and transition matrices are available on Credit Risk IQ.
Download
[1] By extension, more transparency can also broaden and deepen liquidity
[2] The balance between credit downgrades and credit upgrades can provide advance warning of changes in default risks. This metric can be volatile from month to month, but rolled up over 6 months or more it can reveal regular credit cycles.