Renewable energy is at the centre of efforts to tackle climate change, but there have been setbacks. Deloitte summarise:
“In 2022, US renewable energy growth slackened its pace due to rising costs and project delays driven by supply chain disruption, trade policy uncertainty, inflation, increasing interest rates, and interconnection delays. Many of these challenges will likely carry over into 2023, creating strong headwinds.”
According to the UN, their Renewables 2022 Global Status Report shows that “…global energy transition the world had hoped for is simply not happening.”
But Deloitte add a positive outlook: “Growth will likely accelerate, powered by robust demand and the record-breaking raft of clean energy incentives in the Inflation Reduction Act (IRA).”
Fossil fuel companies have reported record profits as global energy prices have spiked. An investment surge – for all energy sources and technologies – seems likely. Current energy investment runs at $2trn pa, with an increasing skew towards renewables:
Detailed consensus credit data is available on Bloomberg or via the CB Web App, covering many otherwise unrated companies. To arrange a demo of all single name and aggregate data detailed in this report, please request this by sending us an email.
Global Energy Investment by Region
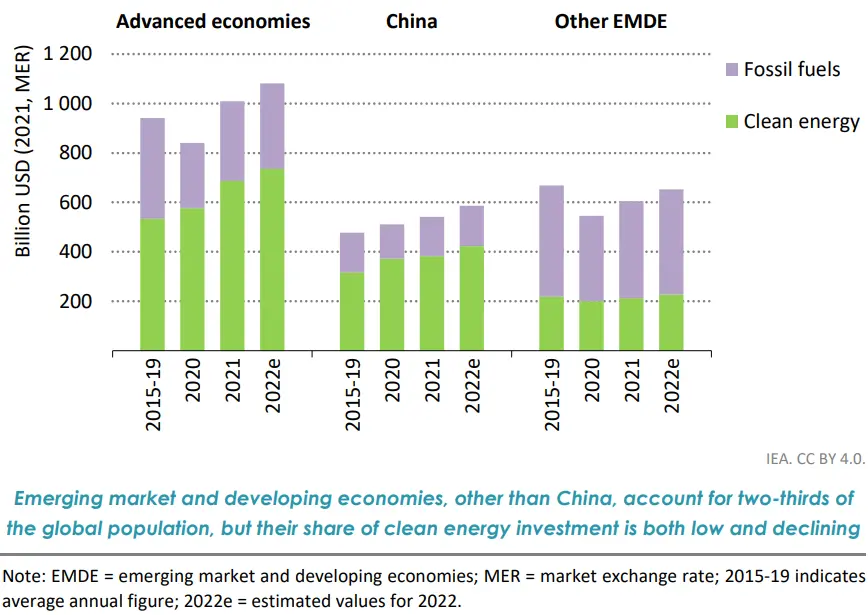
But 80%+ of energy demand is still met by fossil fuels, a stubbornly high proportion: post-Covid energy demand growth was largely met by non-renewables. European shortfalls due to the Ukraine war have brought more coal and oil back on stream, plus bonanzas for US and Norwegian gas suppliers. Projected peak dates for oil and gas demand keep getting pushed out.
But even without pandemics and wars, renewables face economic challenges. In a recent paper, Benthem et al. discuss limits on physical transition rates and risks of aggressive divestment.
Some considerations quoted in the paper are strictly commercial: “…we’ve concluded that our company can’t create value for shareholders by going into wind and solar” (Mike Wirth, Chevron CEO).
And practical obstacles also distort the commercial picture: “We cannot start enough new green companies to get to net zero. It’s simply not possible…The incumbents matter, they must transition, they must be rewarded”. (Bernard Looney, BP CEO)
Low interest rates have driven down the cost of capital for new investment projects – so rising rates might help the commercials. Effective carbon capture might buy more time for transition, although more radical steps are likely to have a growing political and social following.
If renewables businesses are unattractive investments, are they also bad credits?
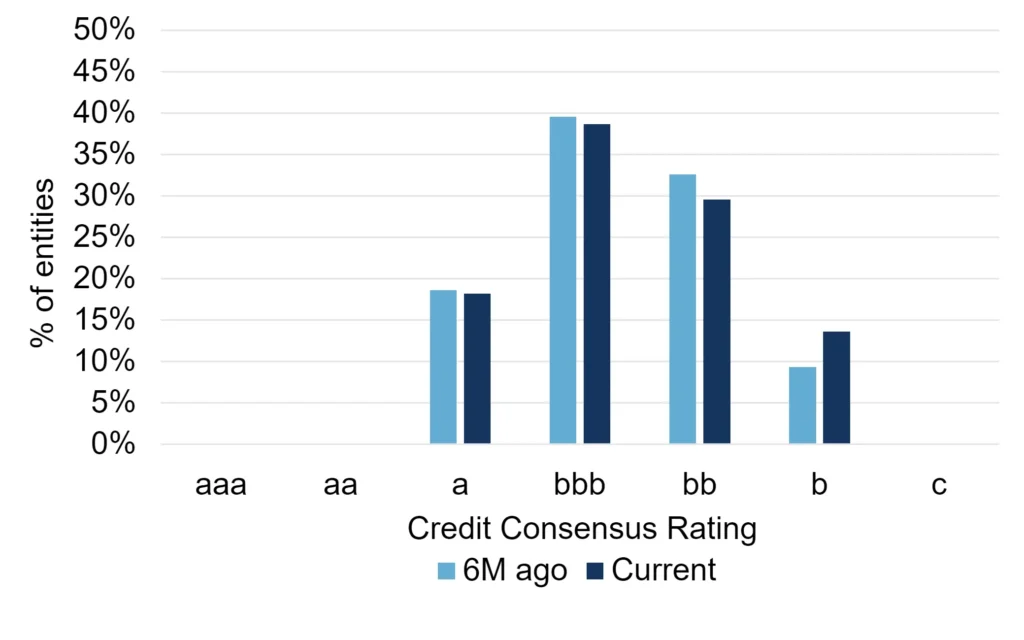
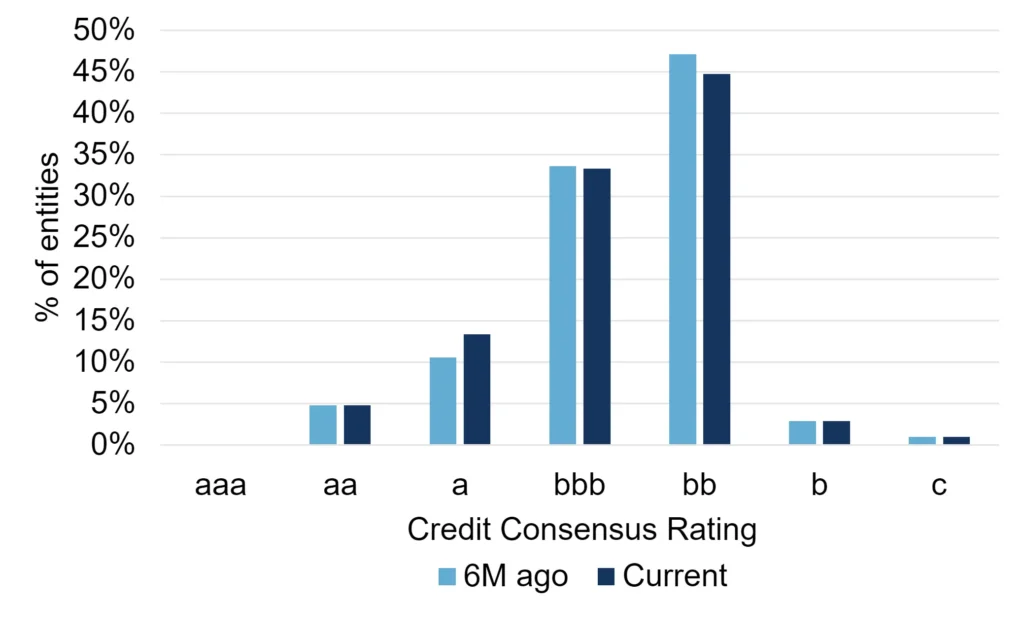
The credit distributions below suggest not; Renewables companies are on average better credit risks than the traditional Oil & Gas sector:
Renewable Energy (44)
Oil & Gas (105)
Note: A list of constituents for the above credit indices (Renewable Energy and Oil & Gas) is available at the bottom of this report as a downloadable appendices.
Renewables are clustered in the centre of the scale, with bbb firms as the largest category (bb for Oil & Gas). But the b category has increased in recent months, while the Oil & Gas distribution shows a modest move in the opposite direction.
These changes reflect a dramatic change in average PDs for the two groups (44 Renewables firms, 105 Oil & Gas firms):
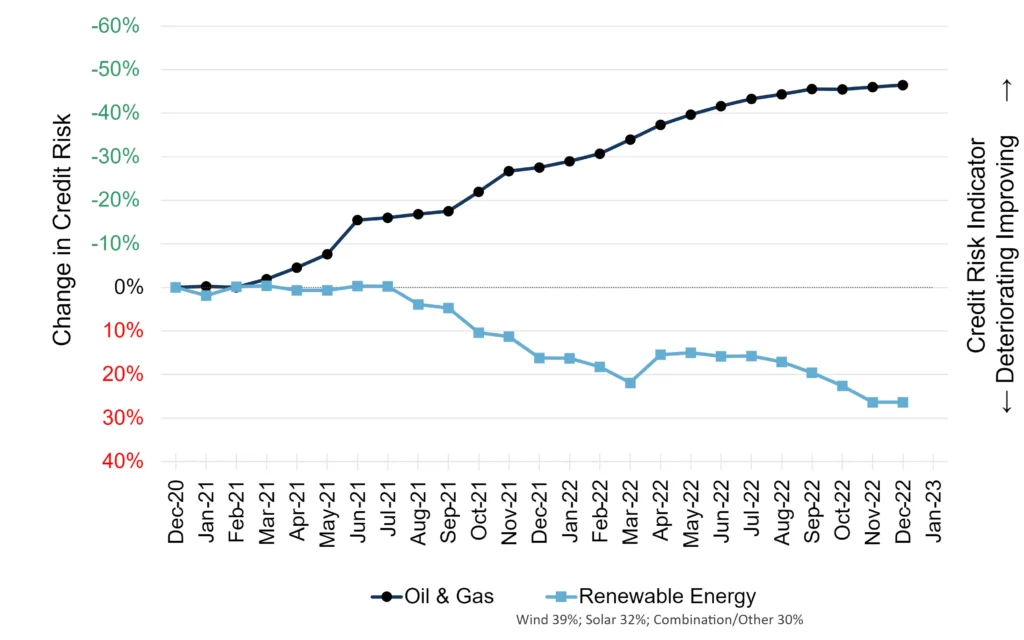
In the past two years, renewable credit risk has deteriorated by close to 30% and traditional energy has improved by nearly 50%.
Fossil fuel is booming because supplies are reliable, adjustable and easily available; renewables like solar, wind, hydro and even bio are at the mercy of the weather. This volatility discount on renewables has made transition difficult, but the cost of solar and wind has dropped enormously in recent years and should continue to do so.
Fossil fuel is booming because supplies are reliable, adjustable and easily available; renewables like solar, wind, hydro and even bio are at the mercy of the weather. This volatility discount on renewables has made transition difficult, but the cost of solar and wind has dropped enormously in recent years and should continue to do so.
But as the below upgrades vs. downgrades1 charts illustrate, there are some signs that the credit tide may be turning:
Renewables
Oil & Gas
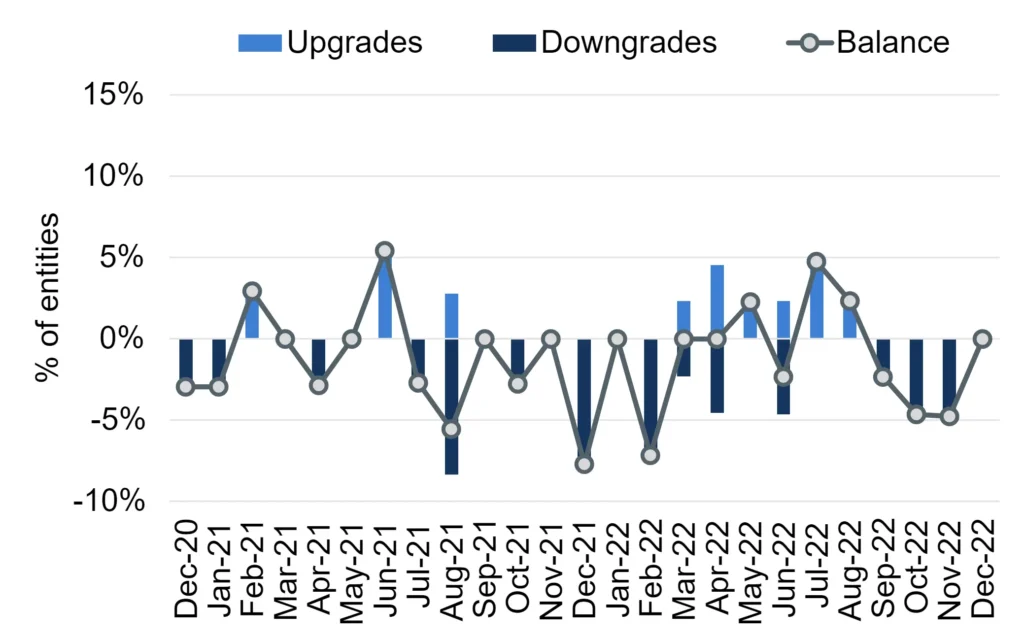
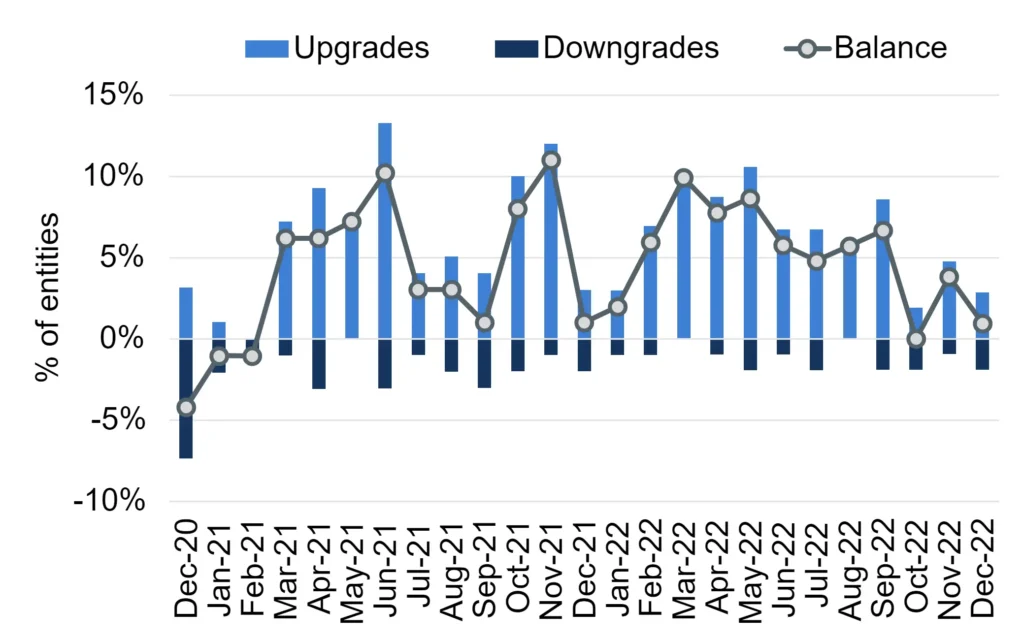
The most recent balance between upgrades and downgrades is turning positive for renewables, but heading towards negative for traditional firms.
This is encouraging – energy shocks bring higher prices, but they also propel the search for new supplies and new technologies. Fossil fuels are a luxury with increasingly unaffordable costs for the environment; but while the short term effect of the energy shock may be more fossil extraction, it may also accelerate the transition to more sustainable sources. Higher prices are a major political and social issue, but they also rebuild balance sheets and fund further investments.
[1] The upgrades vs. downgrades graph looks at the percentage of entities upgraded and downgraded in each month; the rating changes are defined using CB21 credit category scale. It also plots the balance between upgrades and downgrades, highlighting any bias in rating changes.
