Download the full whitepaper below.
The COVID-19 pandemic has pushed global personal savings to record levels, estimated by Moody’s to represent 6% of Global GDP ($5trn). This brings the prospect of a major consumer spending spree and general economic boom as the world emerges from lockdown.
But chronic material shortages and general supply bottlenecks have raised the ancient spectres of cost-push and demand-pull inflation, while the recent Greensill failure has focused attention on supply chains, trade finance and trade credit insurance.
Even before the pandemic, global supply chains were showing signs of strain. Now that the world economy is in the process of a full-scale restructuring, the credit implications are wide-ranging and long-term. COVID has been a catalyst, but globalisation was already in retreat, and tackling climate change is now a political and corporate priority.
This whitepaper details some factors reshaping supply chains and presents single company case studies using a combination of Bloomberg supply chain data and Credit Consensus Ratings (“CCRs”). With almost 60,000 CCRs available globally, 75% of which are unrated by the major credit rating agencies, it is now possible to monitor credit risk across a much larger set of otherwise unrated customers and suppliers. This data can also be used in aggregate form to detect sector turning points in credit cycles, and to finesse terms of trade during periods of inflation uncertainty.
For CFOs, Group Treasurers, Procurement Managers, and participants in the trade finance sector, it highlights the value of CCRs in assessing current and future counterpart credit risks.
Download the whitepaper below for the full insights including:
- Managing payables and receivables (Greensill)
- Receivables Case Study: Rio Tinto (Aluminium)
- Payables Case Study: General Motors (Aluminium, Semiconductors etc.)
- Inflation hedges: avoiding the impact of supply chain bottlenecks in credit portfolios
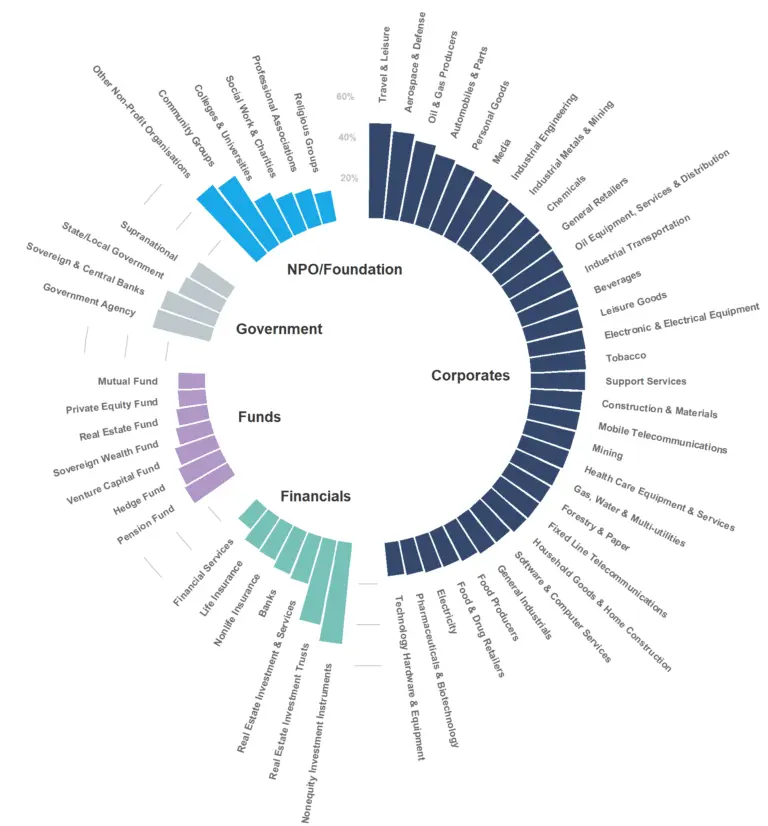
Figure 1: Balance of Downgrades Net of Upgrades, Global Sectors, 12 Months to March 2021

Figure 1 is an example of the visual analysis within the whitepaper, and shows the balance of downgrades net of upgrades for many global sectors with credit consensus coverage in the 12 months to March 2021. All of these sectors show net credit deterioration in this time period, with the severity of the deterioration visible along the centre top axis (0-100%).
The chart shows that the essential sectors – Technology, Electricity, Telecoms, Food, Pharmaceuticals, General Industrials and Household Goods – had the smallest downgrade net balance. Discretionary, leisure and personal transport spending – captured by Travel & Leisure, Oil & Gas, Aerospace, Autos and Media – had some of the highest net downgrades.
As the post-COVID path of inflation becomes clearer, consensus data can be used to track the cumulative credit impact on industries, sectors and individual companies.
Credit Benchmark data is now available on Bloomberg – high level credit assessments on the single name constituents of the sectors mentioned in this report can be accessed on CRPR or via CRDT . Get in touch with us to request your free trial for Credit Benchmark Premium Data and Analytics on Bloomberg.
