Real estate, leveraged loans continue to decline
Key Findings:
- Introduction: Global REITs continue to decline
- Global Corporates vs. Global Financials vs. Global Sovereigns: Sovereign PDs have started to recover
- Industry and Sector Turning Points: UK, Canada now positive; EU, Asia turn negative
- Credit Volatility: Still subdued but recent decline may be bottoming out
- US Sector PD Comparisons: US Leisure Goods is largest monthly drop
- Leveraged Loans: Underperforming broader credit indices and further decline likely; UK bucks the trend
- Technology & AI: Hardware outperforms Software, AI running out of steam?
- Credit Consensus Ratings, CDS and CVAs: Filling CVA data gaps as CDS trading volumes drop
- Transition Matrices: COVID-recovery upgrades dominate High Yield; H2 2023 likely to see a swing to downgrades
Introduction
Global REITs continue to decline
Q1 hopes of rapid rate cuts have faded; “higher for longer” seems necessary to avoid the long-term damage caused by entrenched inflation. Price data is giving mixed signals: oil prices +11% last month, but global food prices down about 2% in March. There are many local variations; recent UK inflation numbers reflected higher imported food prices but lower end-user energy costs; Eurozone inflation also looks stubbornly high.
So far this year, at least 45 countries have hiked, but real rates are still mainly negative (China, Brazil and Mexico are notable exceptions with rates above current inflation; Brazil is the most hawkish of the trio). China is on track to return to normal growth levels this year.
The Economist reports on the robust post-COVID US economy, stronger than most G20 nations. Provided the US avoids a debt-ceiling stand-off at the end of this month, the main risk to US growth is a new regional bank crisis. While SVB and First Republic may not be the last of the tech-focused regional banks to fail, they were probably the largest.
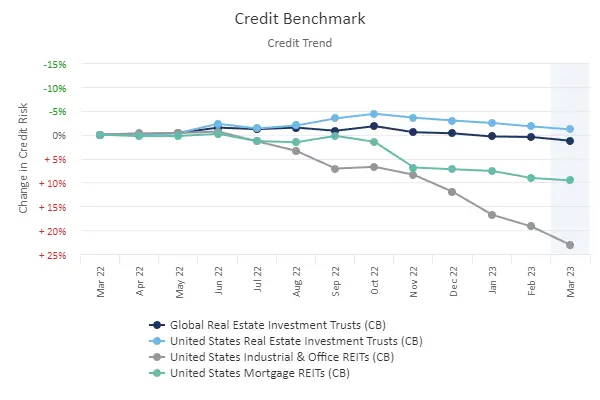
Commercial real estate is a bigger issue for banks across the developed economies. REIT credit consensus indices show steady declines since the end of Q3 2022.
Geopolitics remain tense; the prospect of a new Belarus front in the Ukraine war, and rumoured North Sea sabotage overshadow European business confidence, despite China’s attempts to act as a mediator.
This month’s Credit Outlook covers broad credit indices, sector turning points, credit volatility and default rate projections, as well as trends in the expanding Credit Benchmark Leveraged Loan universe.
In addition, there are sections on interest rate cycles and Sovereign credit risk, credit trends in the AI sector, CVA calibration in the face of declining CDS liquidity, and the use of consensus transition matrices to estimate PD term structures.
Global Corporates vs. Global Financials vs. Global Sovereigns
Sovereign PDs have started to recover
The following charts show global trends for average Probability of Default (PDs) and their 2-year Credit Consensus Indicators (CCIs)1.
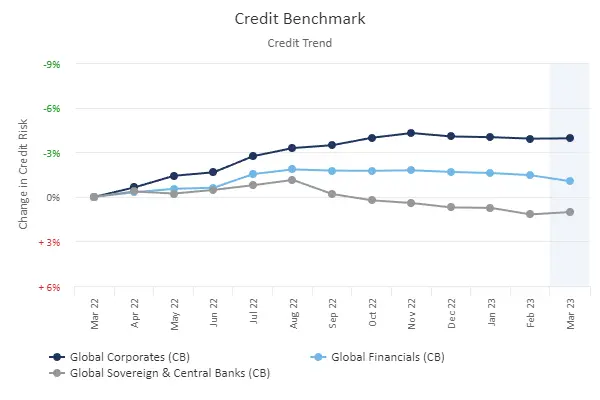
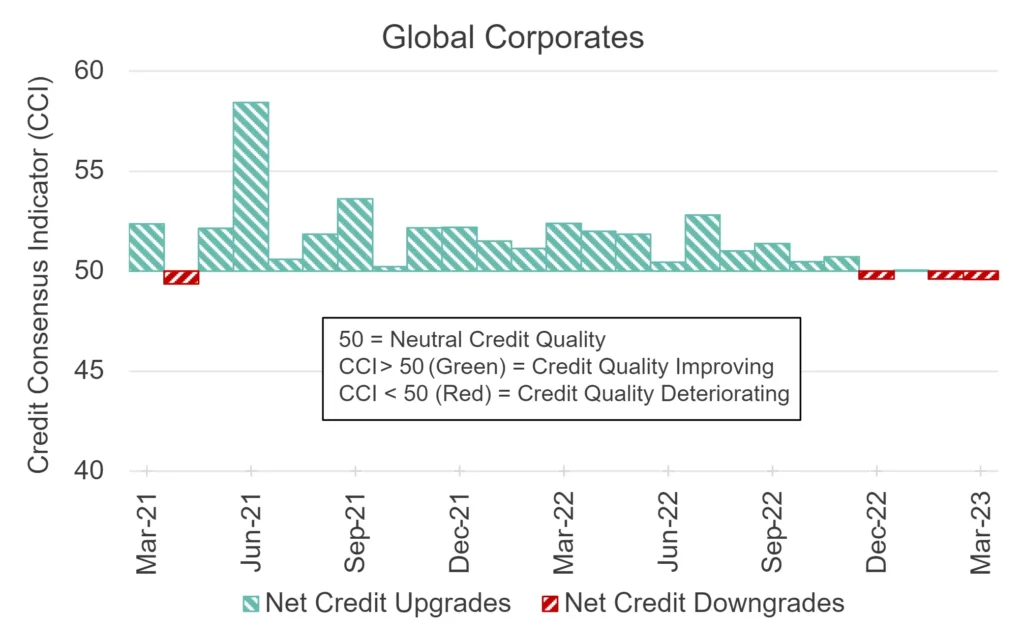
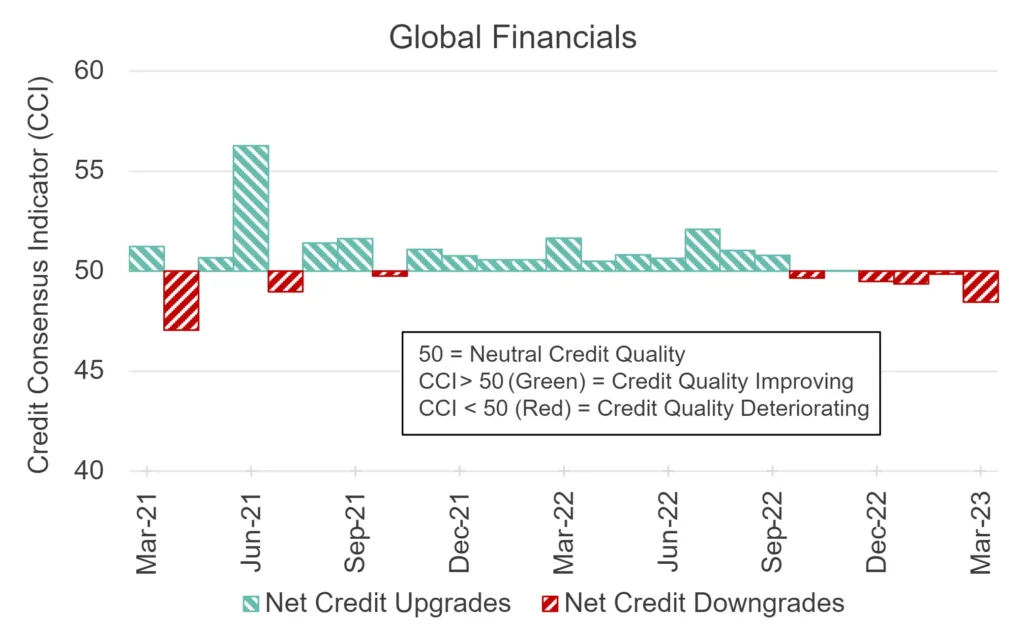
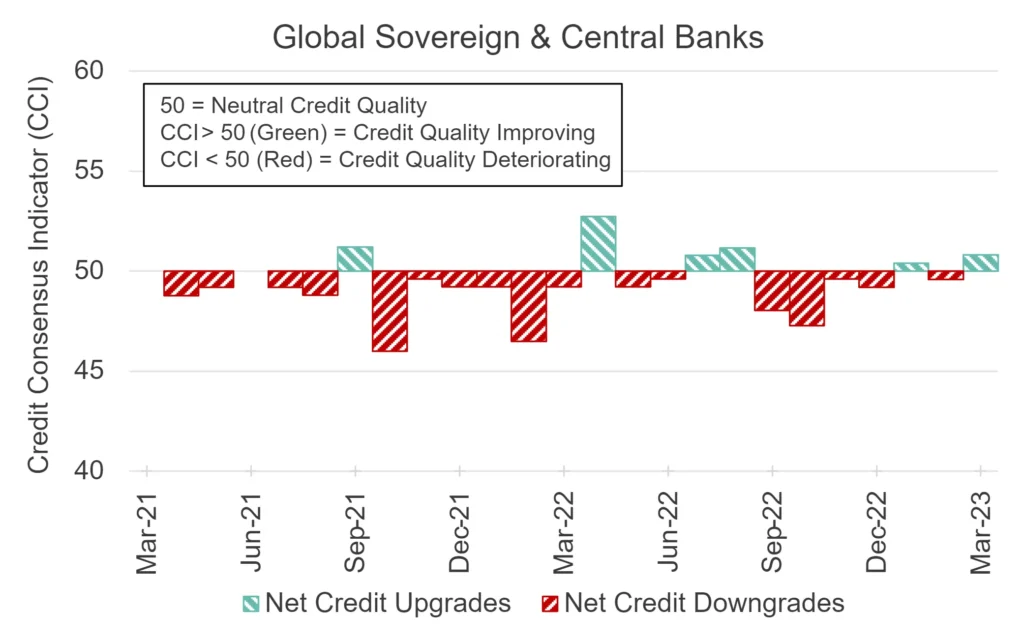
Globally, Sovereign PDs have started to recover after a prolonged deterioration vs. Corporates and Financials, and the CCI has turned positive once again. Corporates and Financials credit indicators are biased towards downgrades.
Industry and Sector Turning Points
UK, Canada now positive; EU, Asia turn negative
The lists below shows detailed global industries and sectors that may be at turning points. These have either started to show negative balances after a run of positives, or vice versa.
| Positive Turning Point: |
| Previous 3M Negative, Current 1M Improving |
| 1. Africa Industrial Transportation |
| 2. Asia Heavy Construction |
| 3. Asia Pension Fund |
| 4. Canada Construction & Materials |
| 5. Canada Farming, Fishing & Plantations |
| 6. Canada Industrials |
| 7. Canada Transportation Services |
| 8. Europe Auto Parts |
| 9. Europe Furnishings |
| 10. Europe Health Care Providers |
| 11. Europe Nondurable Household Products |
| 12. Europe Railroads |
| 13. Europe Real Estate Services |
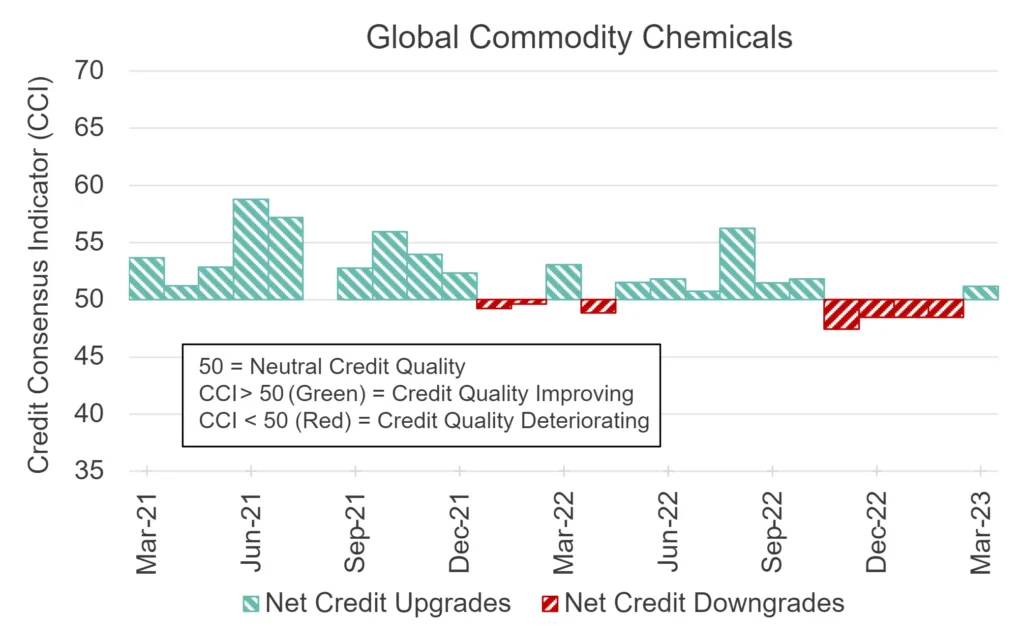
| 14. Global Commodity Chemicals |
| 15. Global Furnishings |
| 16. Global Gas Distribution |
| 17. Global Railroads |
| 18. Latin America Utilities |
| 19. North America Building Materials & Fixtures |
| 20. North America Construction & Materials |
| 21. Switzerland Consumer Goods |
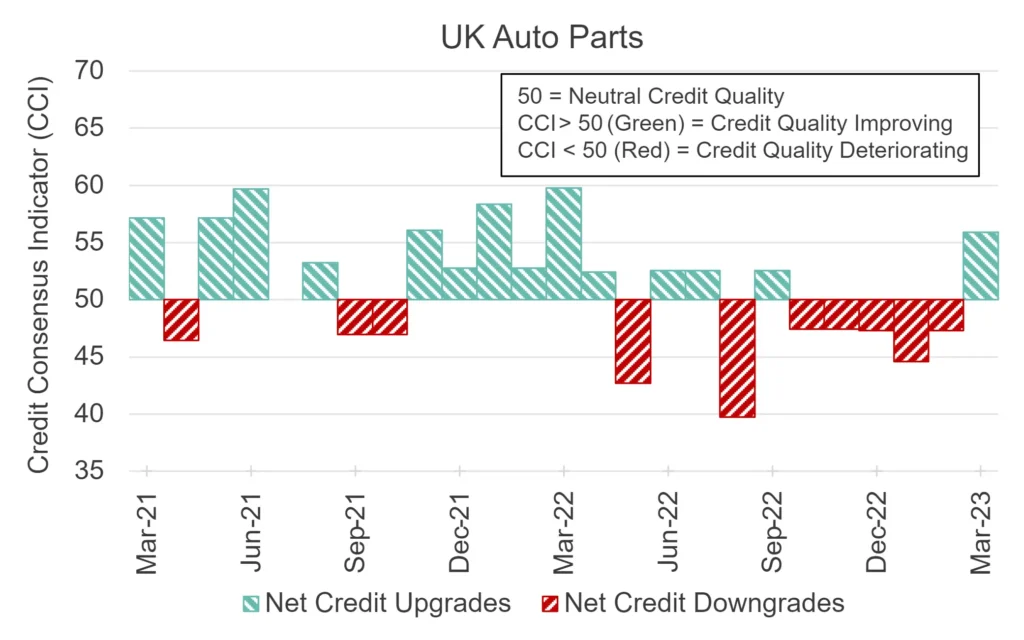
| 22. UK Auto Parts |
| 23. UK Forestry & Paper |
| 24. UK Furnishings |
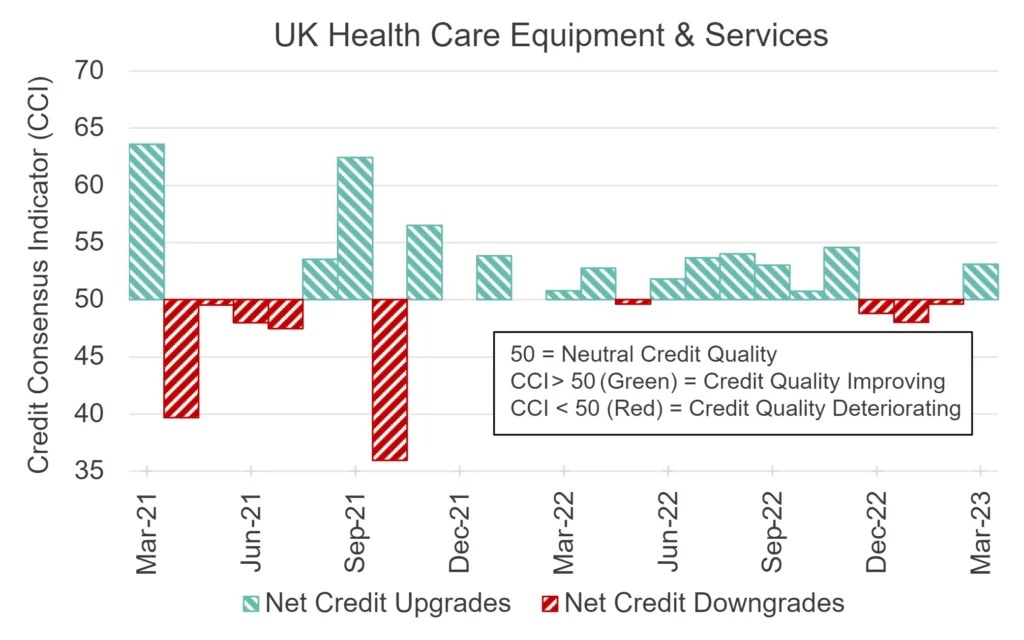
| 25. UK Health Care Equipment & Services |
| 26. UK Health Care Providers |
| 27. UK Industrial Engineering |
| 28. UK Industrial Machinery |
| 29. UK Large Industrials |
| 30. US Building Materials & Fixtures |
| 31. US Farming, Fishing & Plantations |
| 32. US Restaurants & Bars |
| Negative Turning Point: |
| Previous 3M Improving, Current 1M Negative |
| 1. Africa Specialty Retailers |
| 2. Asia Basic Materials |
| 3. Asia Industrial Engineering |
| 4. Asia Technology |
| 5. Asia Technology Hardware & Equipment |
| 6. EU Asset Managers |
| 7. EU Industrial Machinery |
| 8. EU Large Technology |
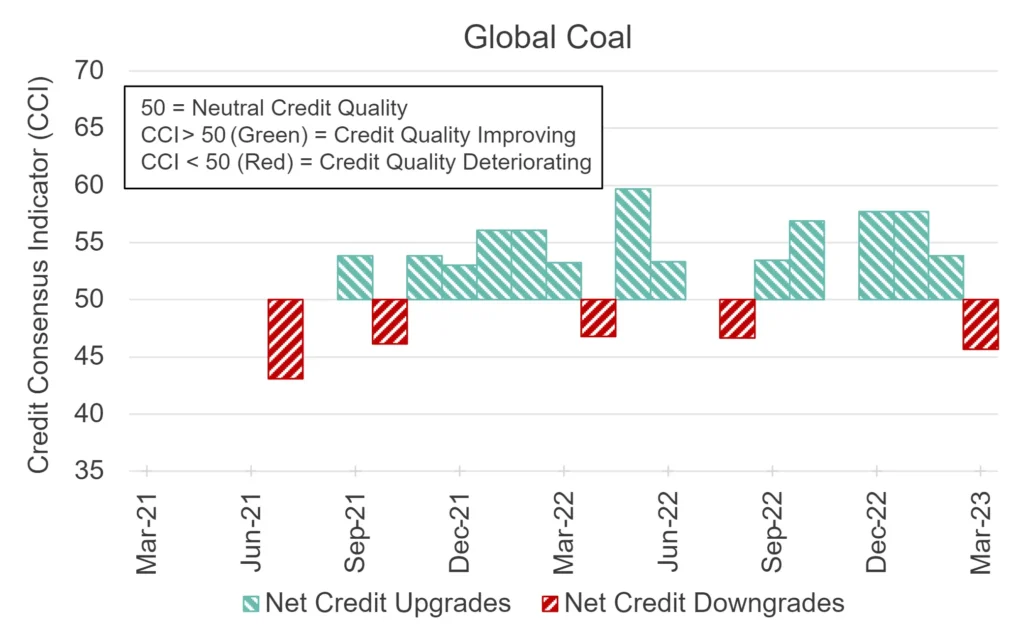
| 9. Global Coal |
| 10. Global Pharmaceuticals |
| 11. Ireland Industrials |
| 12. Mexico Corporates |
| 13. Mexico Industrials |
| 14. North America Oil Equipment, Services & Distribution |
| 15. North America Pharmaceuticals |
| 16. North America Pipelines |
| 17. South Africa General Retailers |
| 18. South Africa Specialty Retailers |
| 19. US Pipelines |
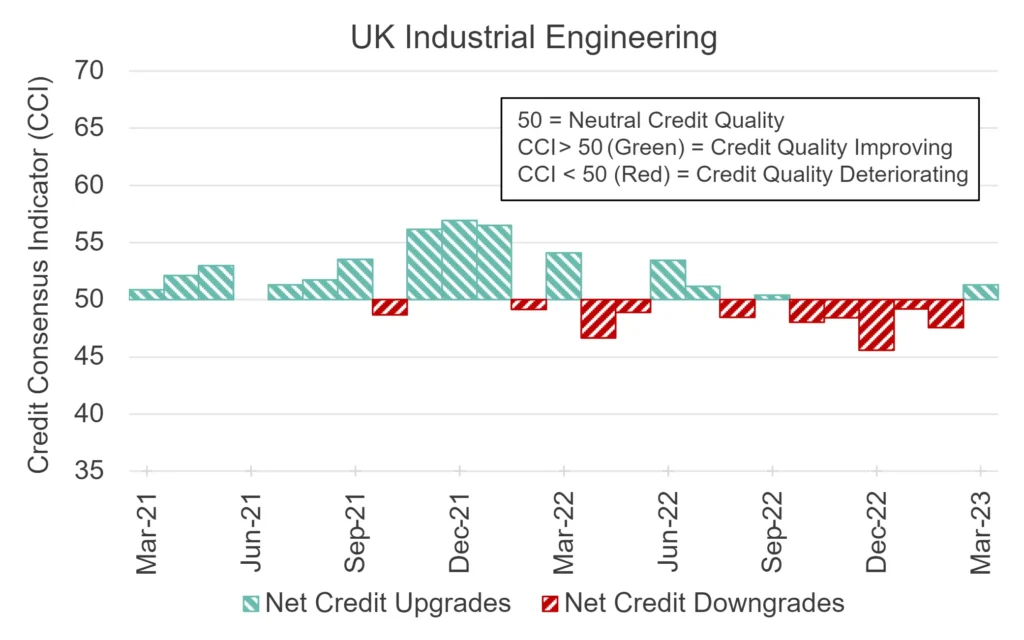
These trend shifts are spread across diverse sectors. After early deterioration, the UK features heavily in the positive turning point list (in green), in particular Industrials industries and sectors. The UK upturn is also driving the broader Europe indices higher. Canada is also turning positive across multiple industries.
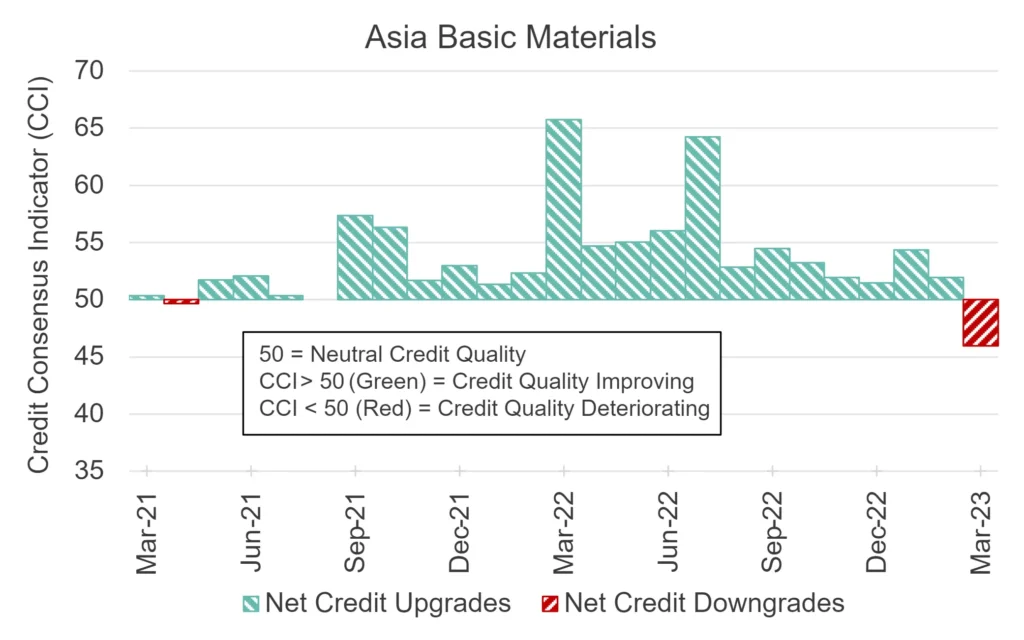
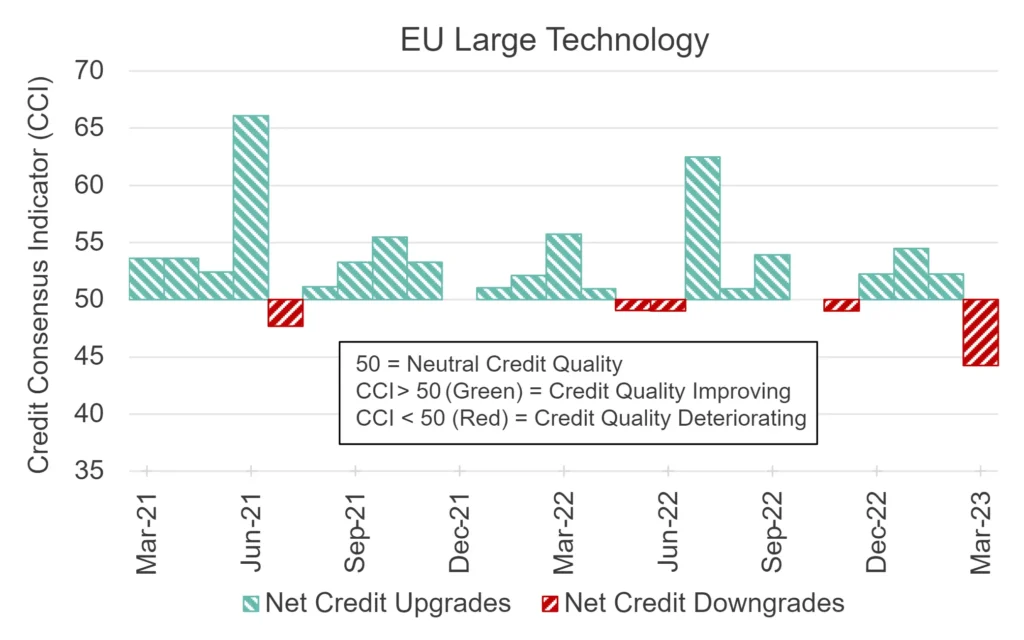
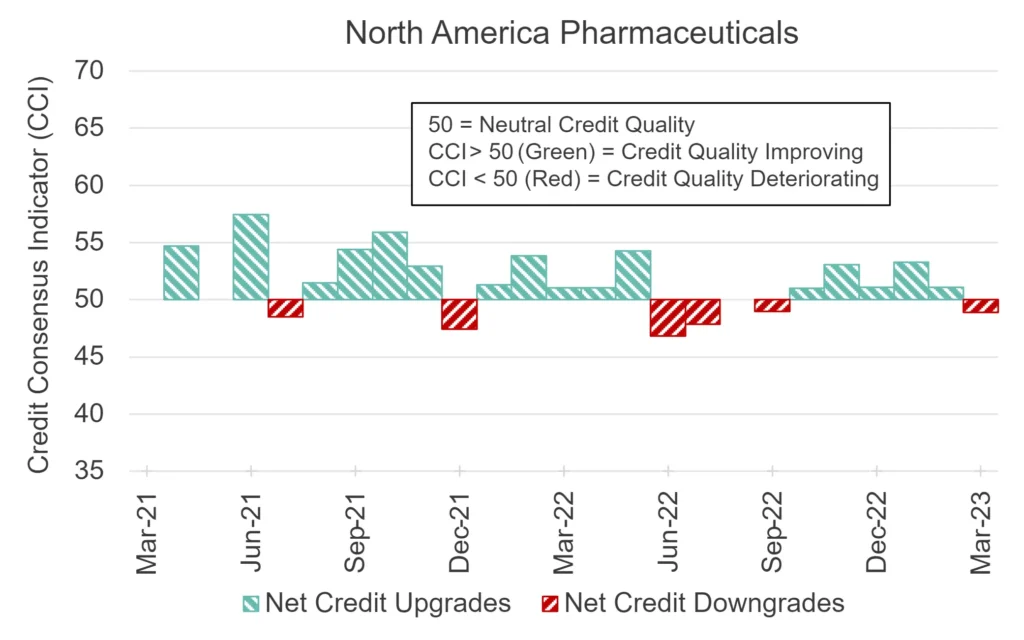
However, EU Industrials and Technology now appear in the negative turning point list (in red), along with some Asian indices. Pharmaceuticals – in North America and Global – are also in the negative list.
The following charts are based on the net balance between upgrades and downgrades which forms the Credit Consensus Indicator (CCI). The plotted indices are examples of some of the Industry and Sector Turning Points listed above.
Positive Turning Point:
Negative Turning Point:
Credit Volatility
Still subdued but recent decline may be bottoming out
The following chart shows percentiles for credit index 6-month rolling volatility. For approximately 1,200 indices, rolling volatility shows the speed and scale of PD changes; these can give advance warning of changes in transition rates. The percentiles plotted here are the most sensitive to turning points in PD volatility.
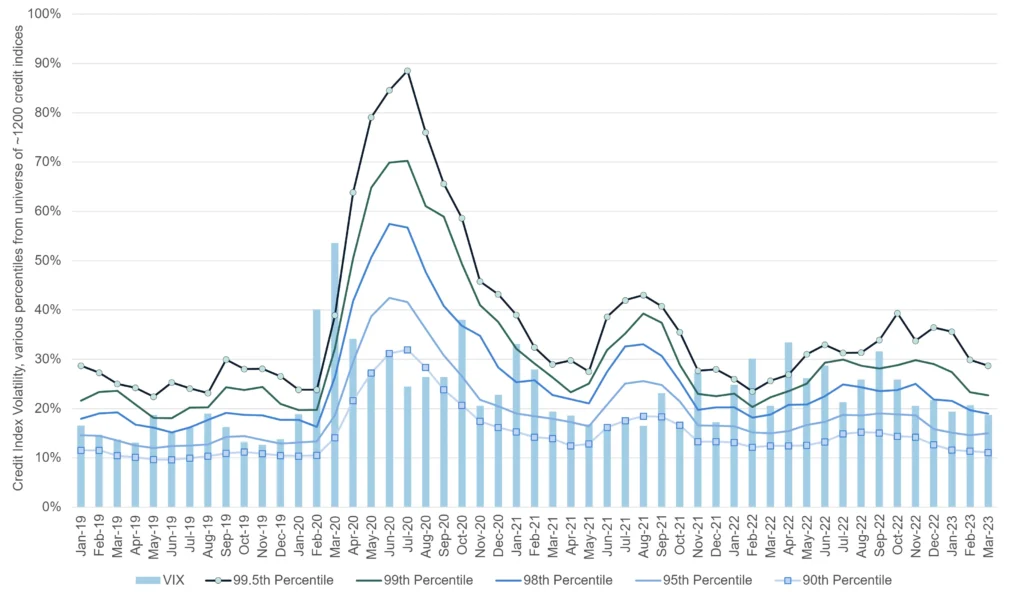
Based on these percentiles, credit volatility is back to Q2 2022 levels after climbing steadily in the second half of last year. The various percentiles continue to drop and the Equity VIX is also subdued.
US Sector PD Comparisons
US Leisure Goods is largest monthly drop
With economies and markets giving mixed signals, there is a lot of uncertainty about 2023 default rates. The following charts compares average consensus default probabilities for a range of US sectors.
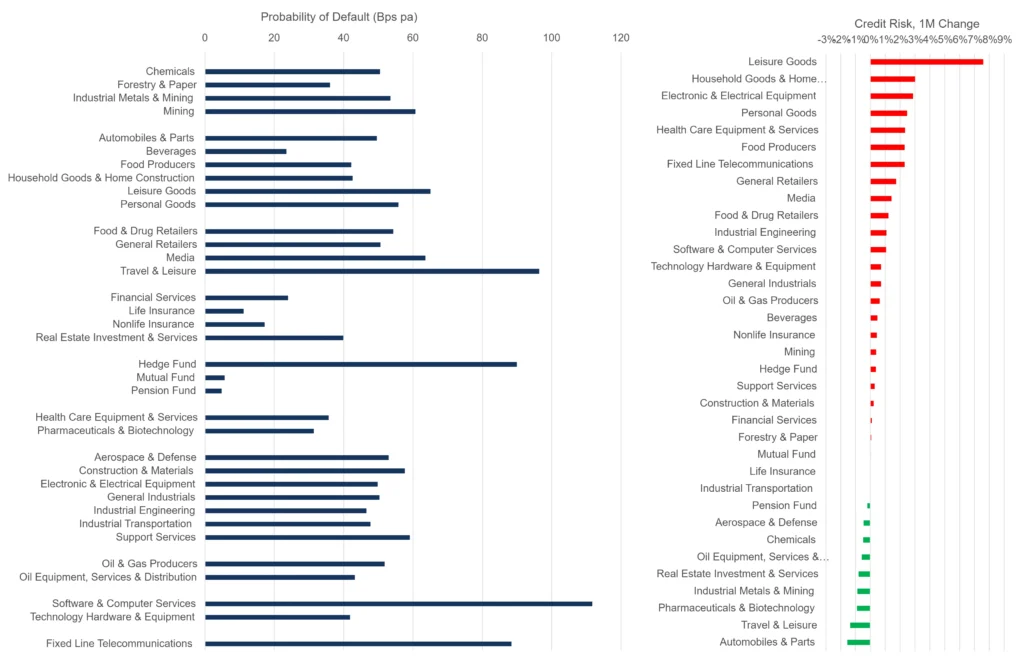
Financials and Funds – apart from Hedge Funds – are very low risk. Travel & Leisure, Software, and Fixed Line Telecomms are highest in the 80 -120 Bps range. The mid range includes Mining, Leisure Goods, Media, Construction and Support Services.
Large sector increases this month include Personal, Household and Leisure Goods, Home Construction, Electronic & Electrical Equipment, Health Care Equipment & Services, Food Producers, Fixed Line Telecomms, Retailers, Media, Industrial Engineering and Software & Computer Services. Improvements include Automobiles & Parts, Travel & Leisure, Pharma, Mining and Real Estate Investment & Services.
These trends are broadly consistent with retrenching consumer and the impact of higher interest rates on the housing and construction sectors. The improvement for autos is a surprise, but auto supply shortages may mean that pent up demand is only now being met.
In coming months, volatility metrics for these industries and sectors in each region will give a strong indication of future downgrades or default rates.
Leveraged Loans
Underperforming broader credit indices and further decline likely; UK bucks the trend
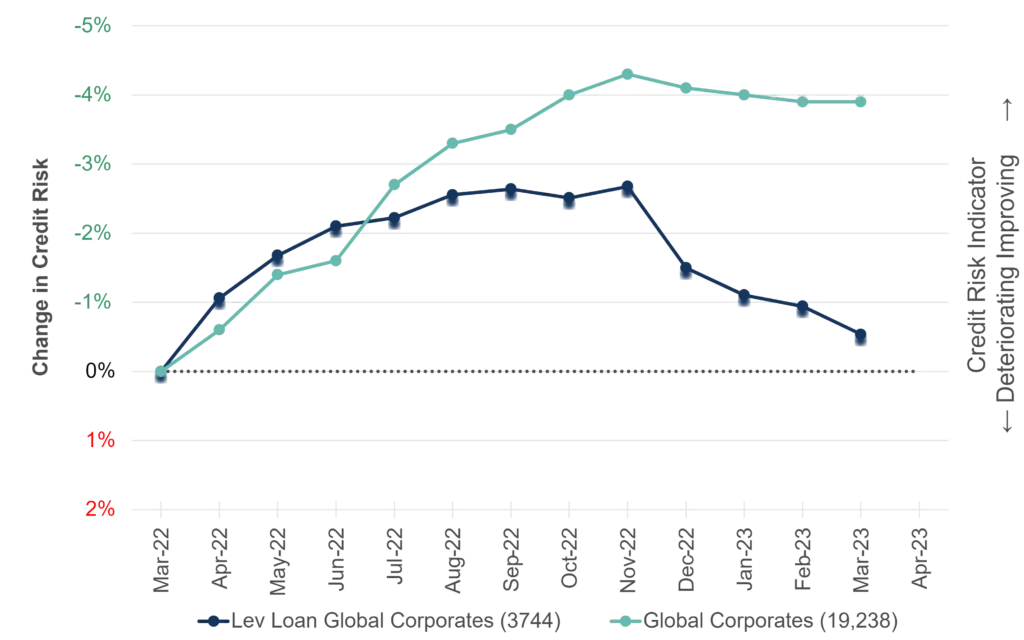
After years of reliable growth, the leveraged loan market faces rising rate headwinds, and recent legal issues may increase the sector risk premium.
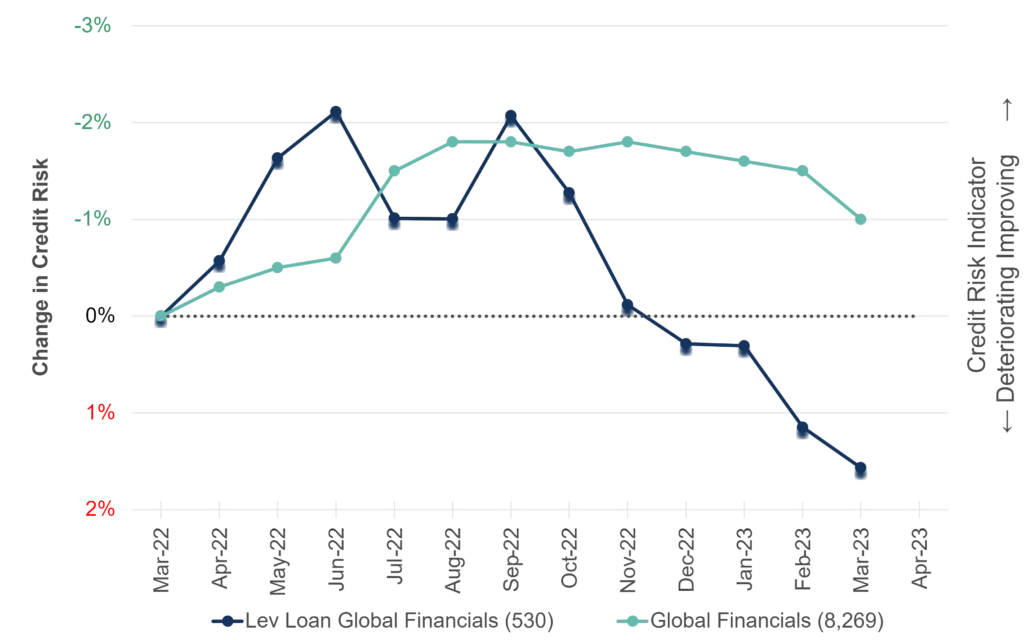
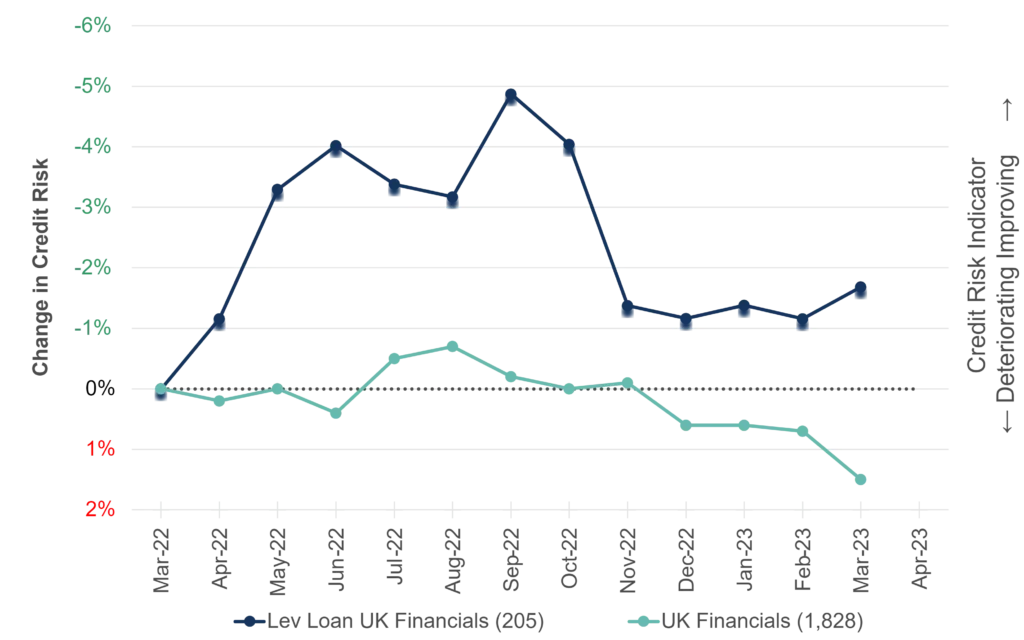
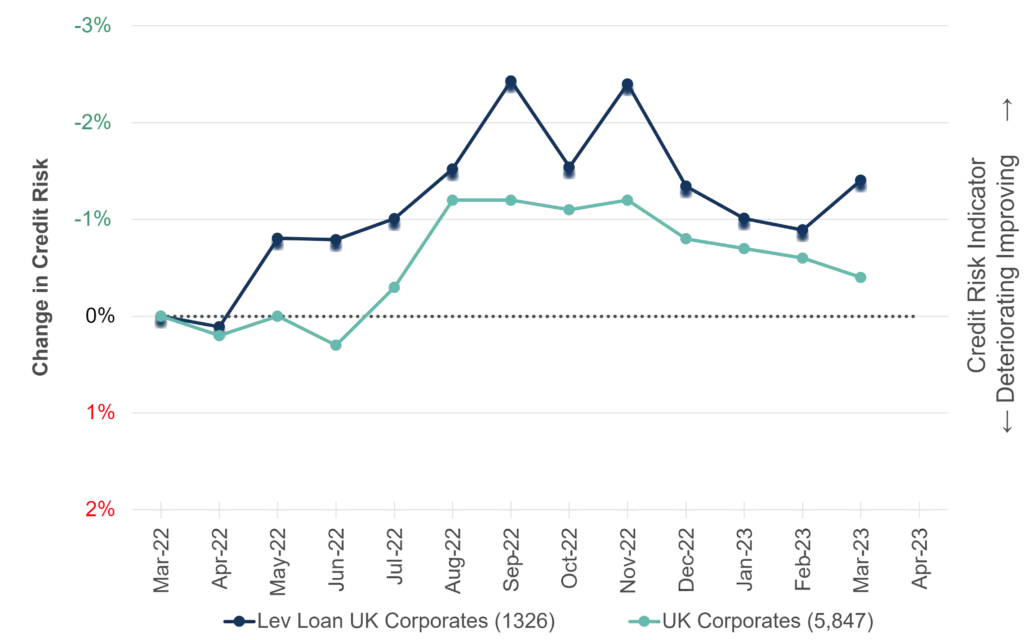
The following charts are based on a universe of 4,000+ Leveraged Loan issuers. The credit trends of these Leverage Loan issuers are being compared with their respective Credit Benchmark index.
Global Financials
Global Corporates
United Kingdom Financials
United Kingdom Corporates
United States Financials
United States Corporates
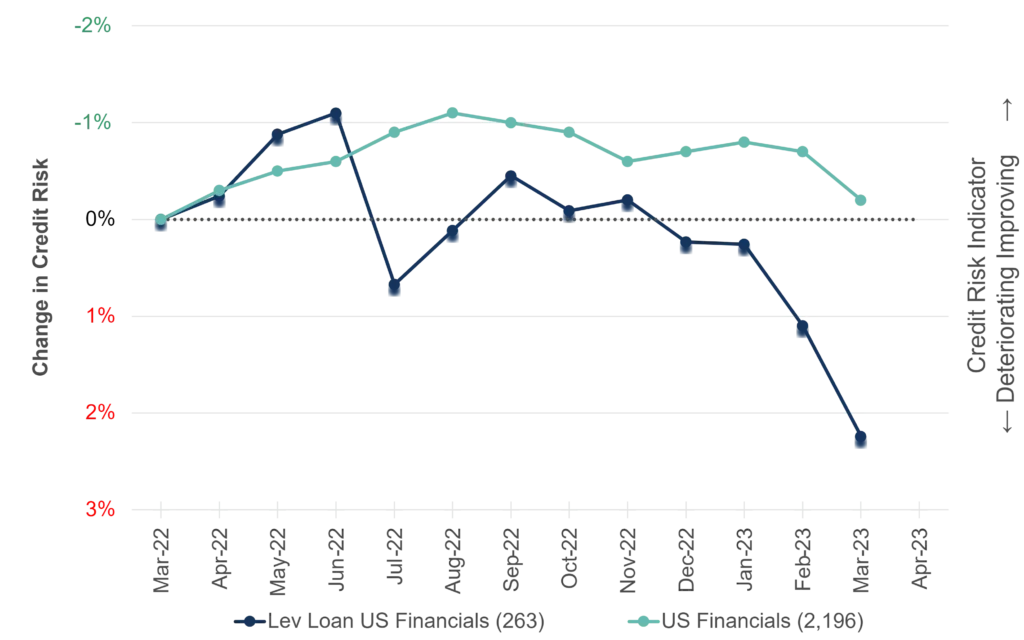
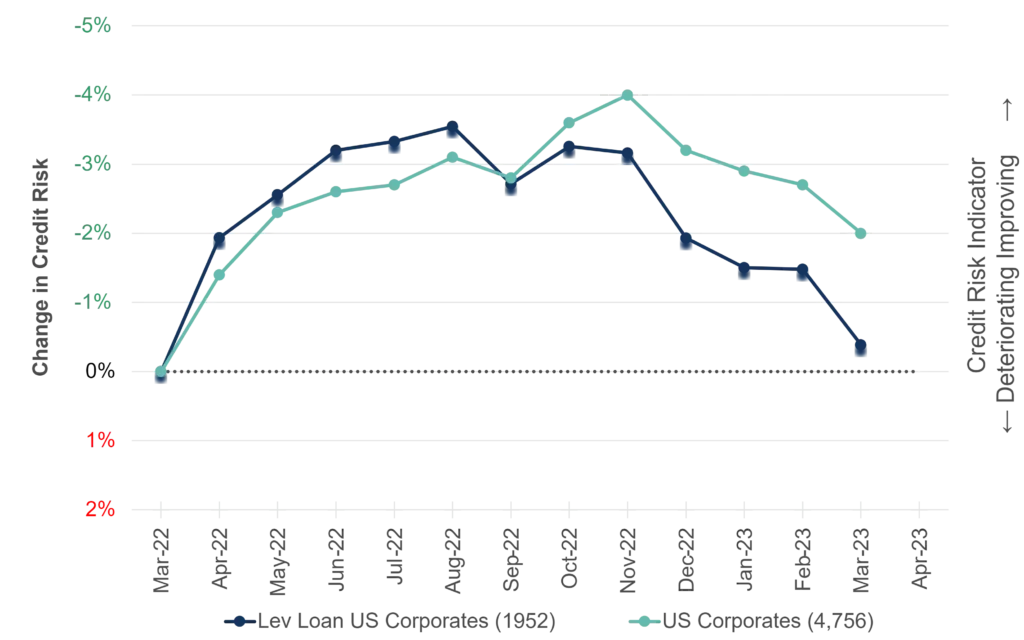
In Q2 and Q3 of 2022, many Leveraged Loan credit indices performed better than their respective Credit Benchmark index. Recent data is more mixed; Leveraged Loan credit indices are becoming more volatile and some – e.g. US Financials – are now underperforming their broader peer group.
Global Corporates have also been underperforming the main index, since late 2022, while Global Financials began to decline in Q3 2022.
However, UK Leverage Loan Financials and Corporates indices show significant improvement in the most recent month, while the broader indices continue to decline.
Technology & AI
Hardware outperforms Software, AI running out of steam?
The charts below show the 2Y credit trend and current distribution of Global Technology Hardware & Equipment and Global Software & Computer Services.
2Y Credit Trend
Current Credit Distribution
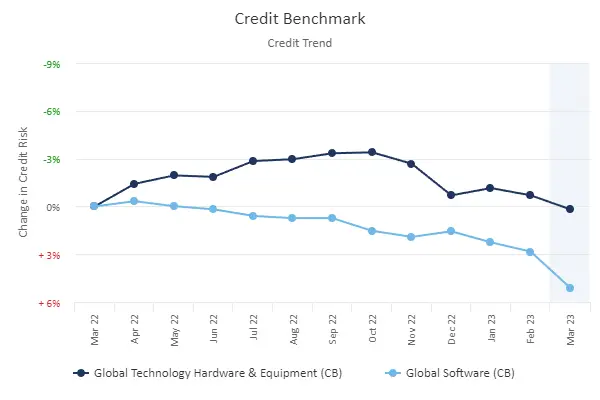
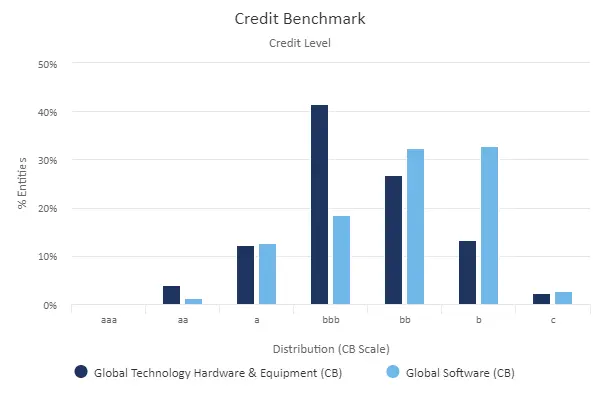
The distribution chart on the right shows that over 65% of the Software entities are already High Yield, while the majority (58%) of Hardware companies are Investment Grade, mainly bbb. Hardware & Equipment and Software & Computer Services credit trends both show further decline this month.
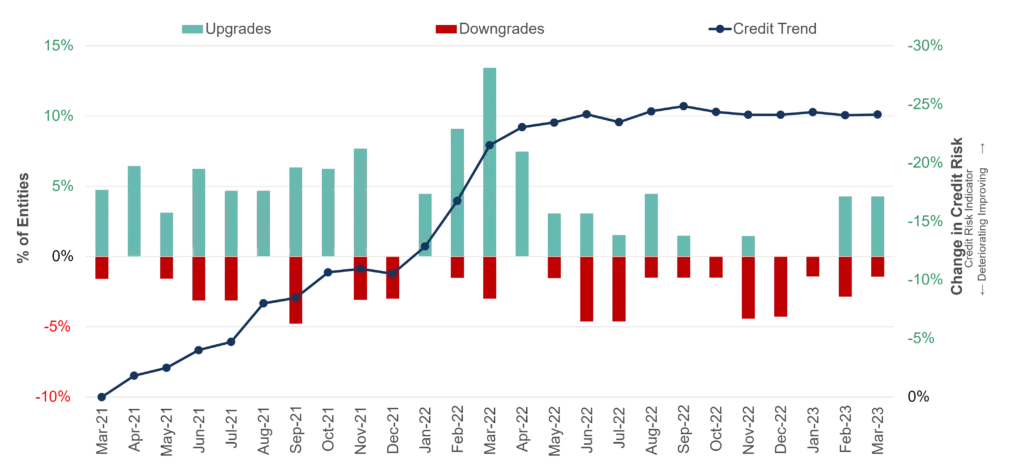
After a difficult 12 months for the technology sector, the AI “arms race” now dominates the outlook. The following chart shows upgrade / downgrade and PD trends for a selected list of 104 mainly US-based AI companies.
After a long period of significant credit improvement (25% between March 2021 and March 2022), the AI universe has been stable for the past year.
Credit Consensus Ratings, CDS and CVAs
Filling CVA data gaps as CDS trading volumes drop
Credit Consensus data complements CDS data in a number of ways:
- Credit Consensus Ratings can be used for counterparts with no corresponding traded CDS.
- Large sample approaches shown here reduce the impact of single name CDS price volatility.
- Bank estimates are unaffected by illiquidity and one-off trades.
Credit Value Adjustments (CVAs) aim to compensate for the risk of a swap counterpart defaulting before transaction maturity. CVAs are calibrated to risk-neutral Probability of Default (PD) estimates, and these are usually derived from Credit Default Swap (CDS) prices for various maturities.
However, CDS market coverage is narrowing, and individual CDS are often illiquid, volatile and subject to a range of distortions. For example, the March 2023 spike in Deutsche Bank CDS prices was mainly driven by one small trade.
Credit Consensus risk estimates (used in bank risk capital calculations) are real-world one-year expected default frequencies, updated every two weeks.
The following chart shows how real-world and risk-neutral estimates are linked. The fitted line is a benchmark for the daily PD / “synthetic” CDS price relationship. As risk premiums shift, the fitted line will rotate clockwise (lower credit risk premium) or anti-clockwise (higher premium).
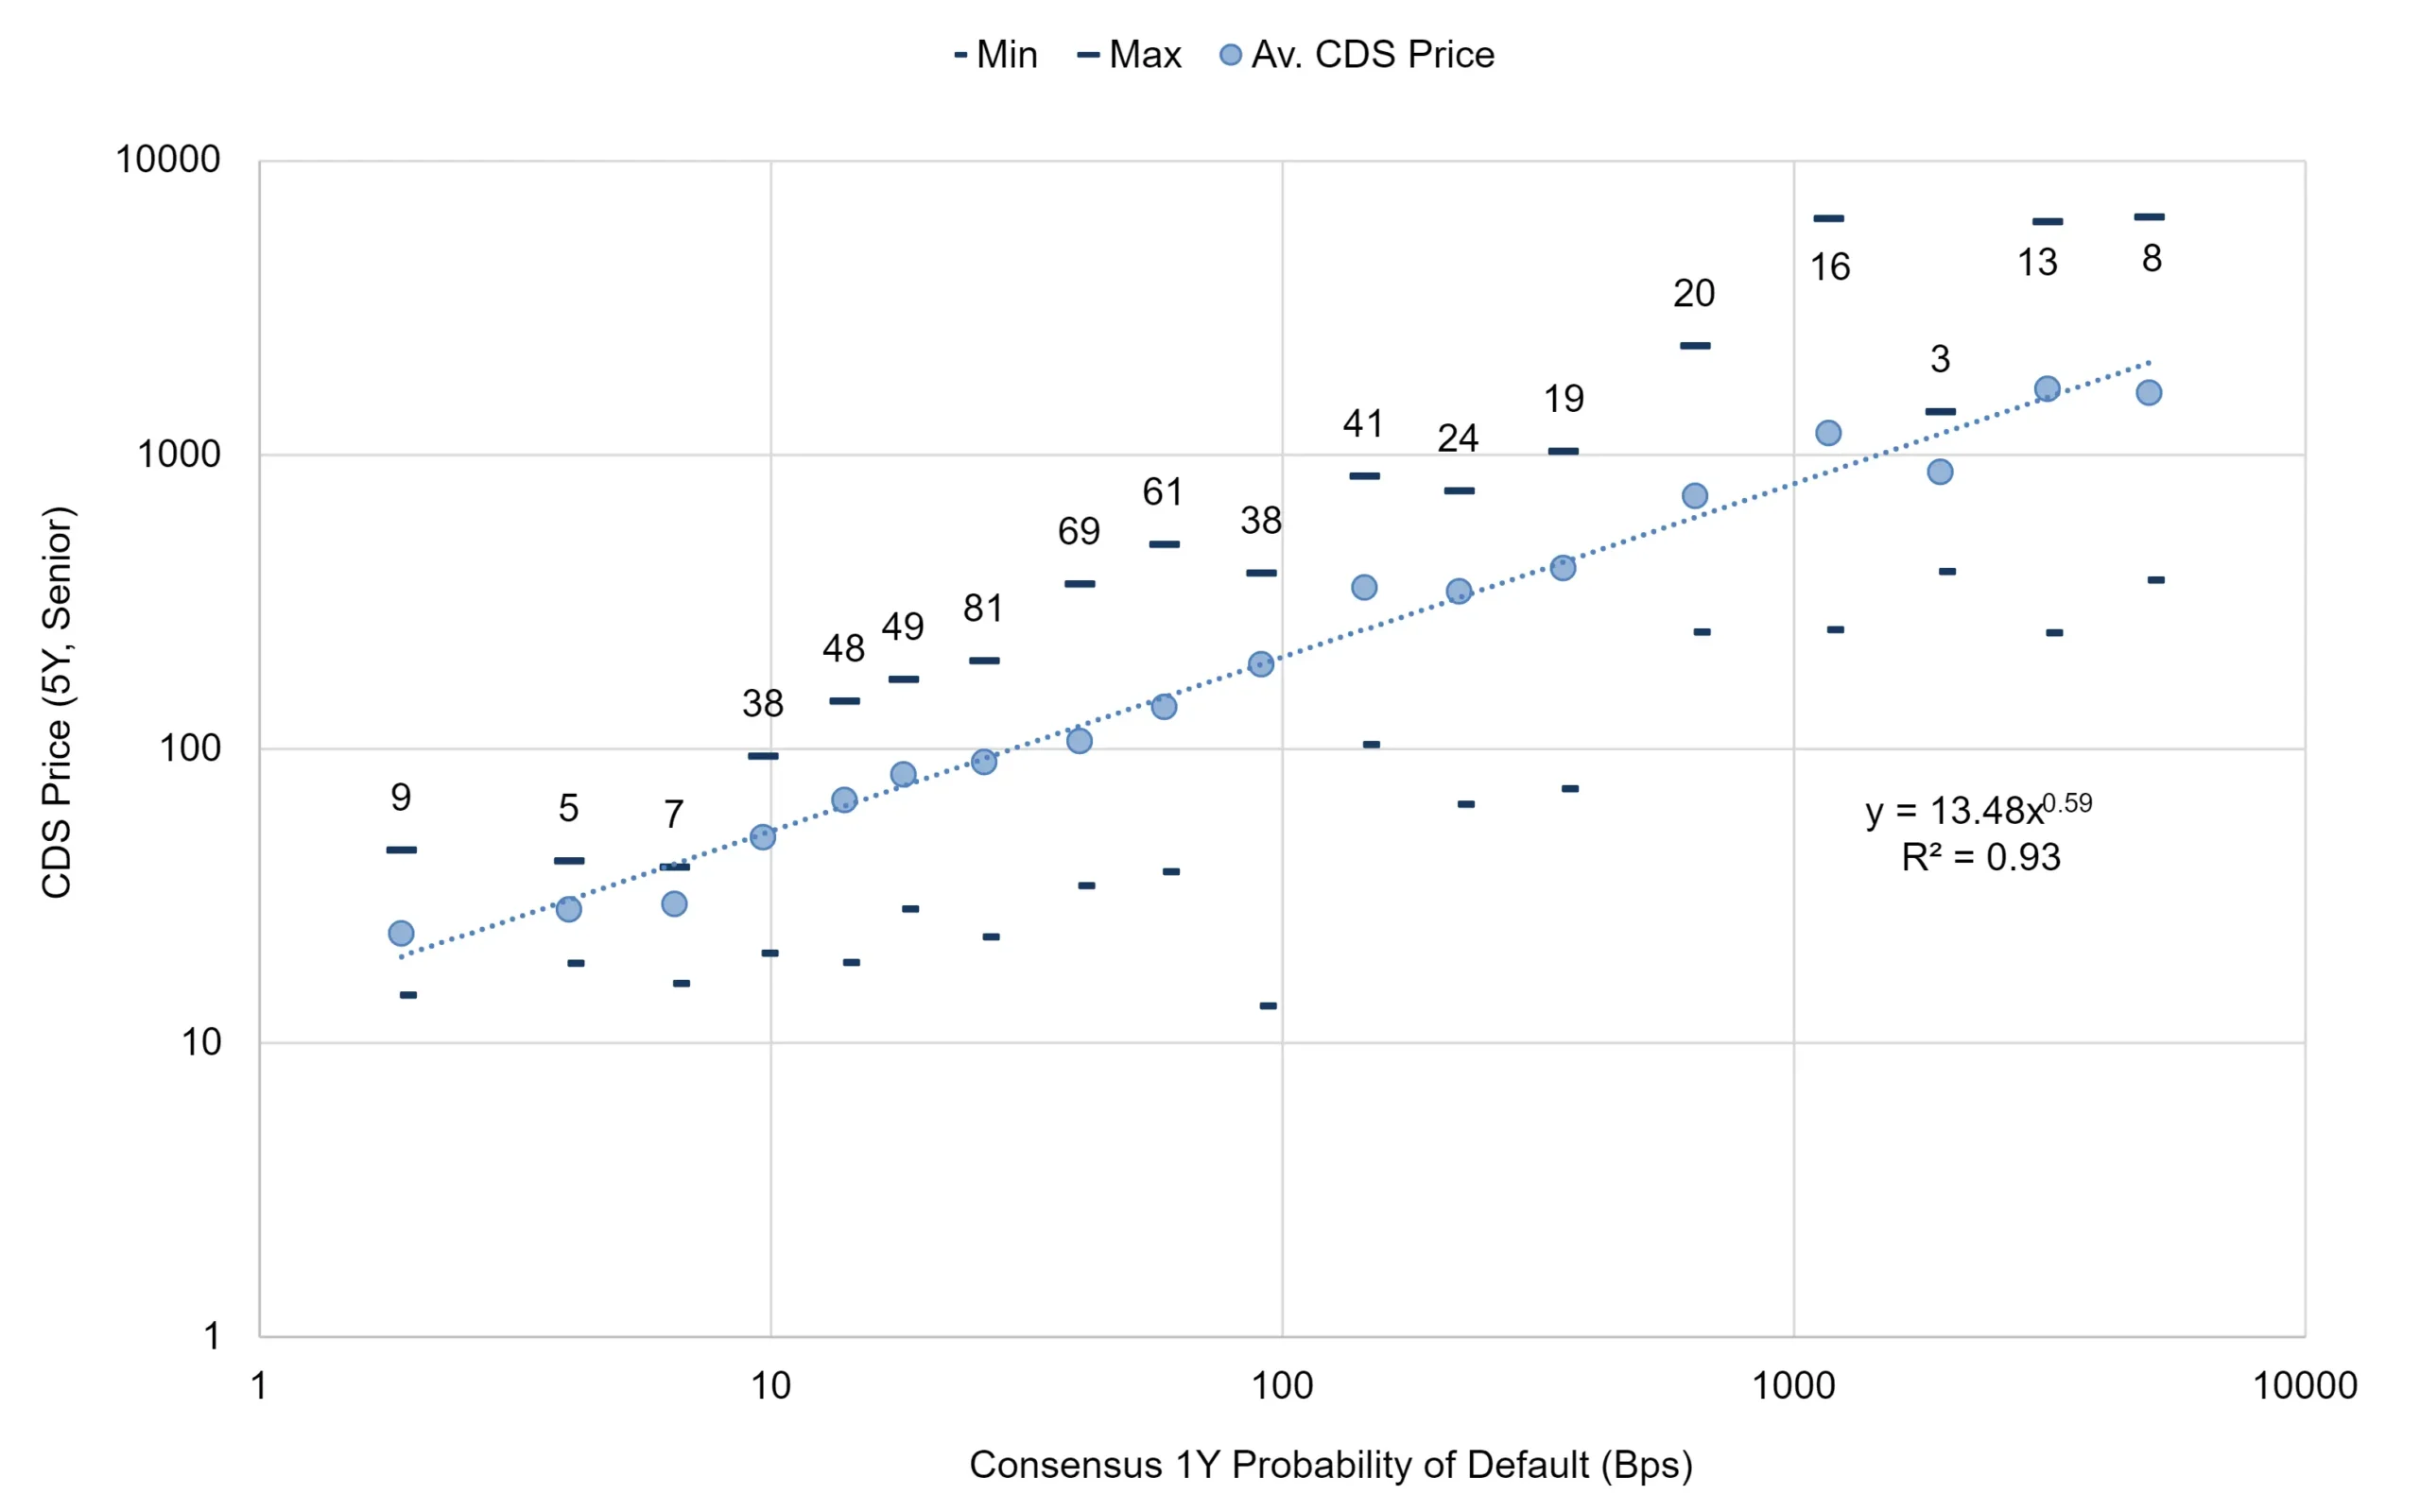
This plots February real world 1-year PDs (credit category midpoints) and late February 2023 5-year Senior CDS prices (log scales), for around 500 Corporates and Financials.
PDs and CDS prices are averaged by credit category.
Min and Max markers show the range of individual CDS prices in each category2, with the issue count in grey.
With an assumed recovery rate, market implied PDs can be calculated for each point on this graph. The difference between market implied and real world PD is the risk premium in PD basis points for each credit category. Other maturities can be plotted if CDS price data is available.
From initial dataset covering issuer PDs and their associated traded CDS prices, it is possible for risk managers to estimate “Synthetic” CDS prices – and CVAs – for counterparts with no agency rating, no CDS and even no bonds.
1-year Transition Matrices
COVID-recovery upgrades dominate High Yield; H2 2023 likely to see a swing to downgrades
The Credit Consensus database now offers a large set of credit transition matrices covering various industries, geographies and timeframes3. Combined with credit volatility metrics, transition matrices can be used to project future upgrade / downgrade and default rates.
The tables below show latest 1-year transition matrices for Global Corporates and Financials.
Transition Matrices: Global Corporates and Financials
Global Corporates
Global Financials
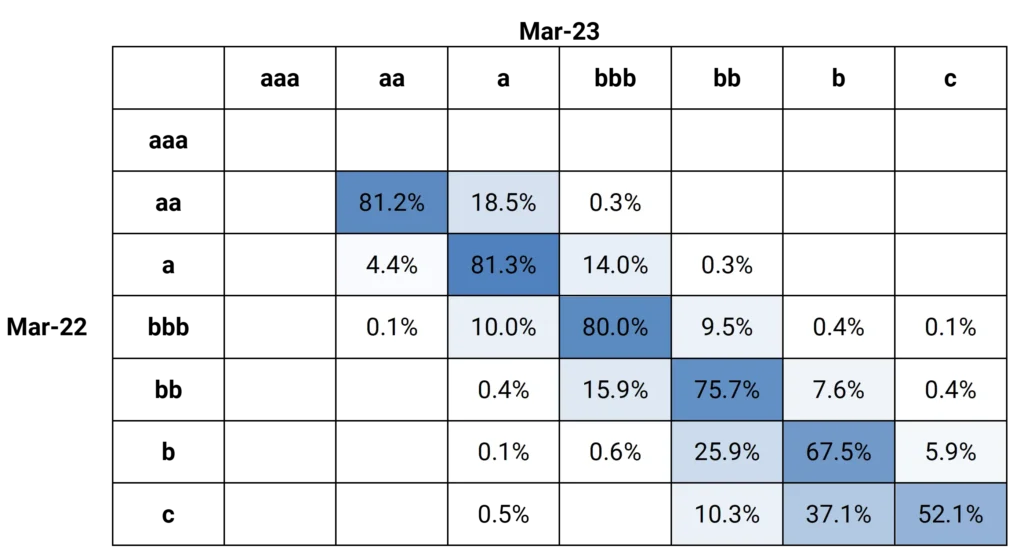
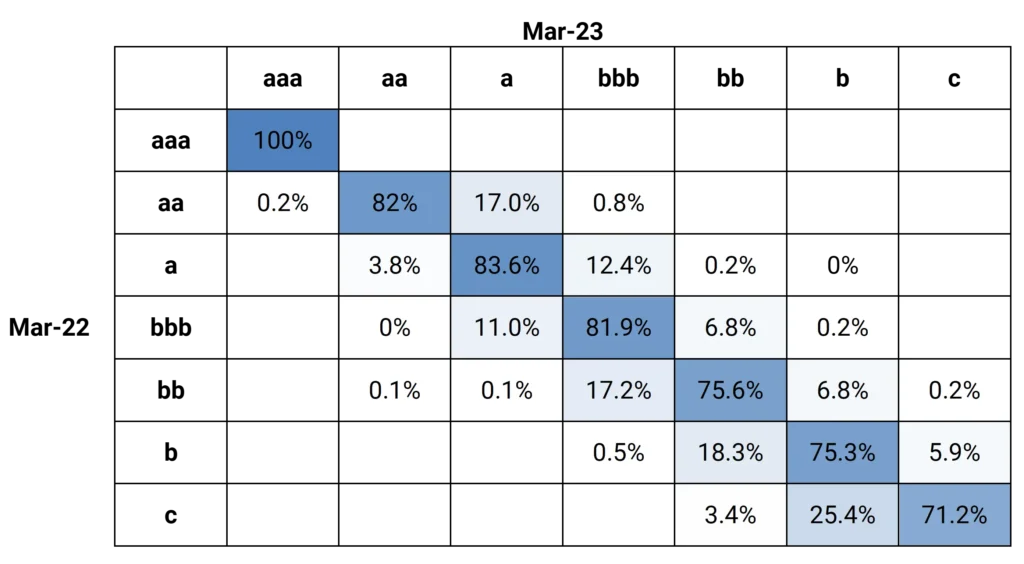
Both categories of borrowers still show a very skewed bias to upgrades in the past 12 months; recovery from COVID outweighed the impact of the Ukraine invasion and rising interest rates. However, the majority of these upgrades are within the High Yield categories. Corporates show higher downgrade rates than Financials.
If credit volatility increases and high rates persist, the “Downgrade Triangle” (the upper right) is likely to dominate.
Transition matrices can also be used to estimate PD term structures as a basis for CVAs. According to BIS guidelines, this approach needs the addition of a credit risk premium (e.g. estimated using the data in the previous CDS chart) to give market implied term structures for a range of countries and sectors.
Credit Benchmark can supply Transition Matrices for 350+ issuer industries and geographies, as well as for bespoke portfolios. To request a bespoke Transition Matrix on your portfolio, please enter your details below:
1The CCI tracks the monthly net level of credit upgrades / downgrades for a given sector, based on the combined risk views of expert credit analysts at over 40 global banks. A CCI score of 50 indicates an equal number of upgrades and downgrades; over 50 is improvement; under 50 is deterioration.
2Individual CDS within each category show wide price variation, reflecting differences in assumed recovery rates and liquidity in the relevant reference bond.
3Credit Benchmark can supply Transition matrices for 350+ issuer industries and geographies, as well as for bespoke portfolios.
