Credit risk elevated but positive surprises possible
Key Findings:
- Financials: Mainstream and Specialized indices show modest but persistent deterioration
- Credit Index Volatility: higher defaults in 2023, but worst case unlikely
- Country and sector correlations are dropping, some negative
Credit fundamentals for 2023 are challenging, but some optimism is appearing. The IMF promised growth forecast upgrades at Davos; the Bank of England believes that its worst-case scenario for the UK is less likely. Fears of serious global recession have eased as inflation forecasts improve and rate hikes slow. The Ukraine war remains a concern, but financial markets started the year with an upbeat tone: energy prices down, equity markets up, long yields off their highs, and narrower credit spreads.
But the end of easy money is hitting consumer-facing and leveraged sectors. Major banks are reserving for higher loan losses in H2 2023. Overall corporate defaults are expected to rise with S&P predicting high yield US corporate defaults to hit 3.5% by June 2023, vs. 1.4% for mid-2022. Moody’s see a range of scenarios from 3.9% to 15.1%, from a current sample level of 2.8%.
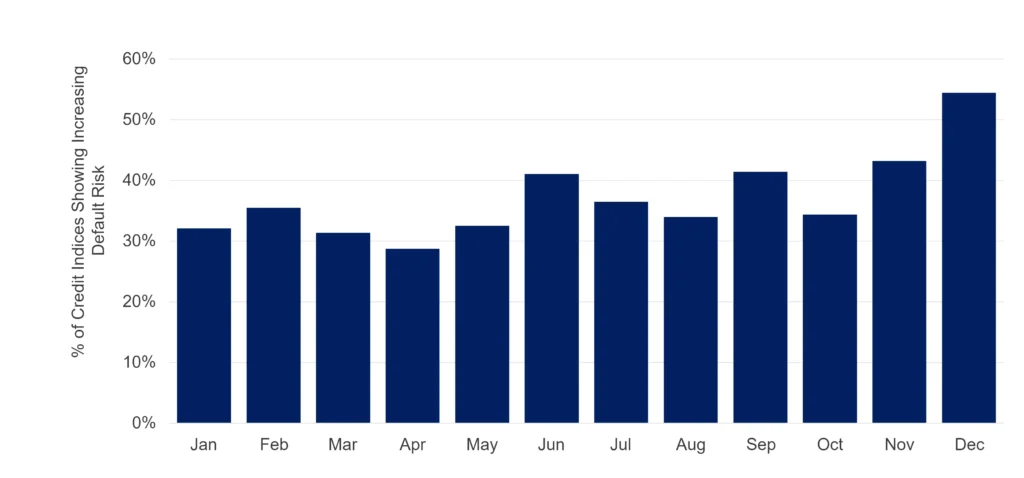
The chart below shows the proportion of Credit Consensus indices with higher risk in the past twelve months.
Detailed highlights from Credit Consensus data:
- Financials: Mainstream and Specialized indices show modest (single digit %) but persistent deterioration across CCPs, GSIBs, Lev Loans and Specialized Lending. Industrial / Office REITs and Mortgage REITs are also deteriorating and this trend is likely to continue and spread to other real estate subsectors. The proportion of Property-focused mutual funds in the highest credit categories halved in the past year but has rebounded in the past few months.
- Defaults and Credit Index Volatility: Elevated at about 35% above its base level, but nowhere near the COVID high. If this climbs further, expect to see more downgrades and higher defaults in 2023, but currently less pessimistic than the agencies. Credit index risk scores show highest downgrade risk in Africa, Turkey and UK / US Telecomms and Software.
- Correlations: Country and Sector correlations are dropping from their very high COVID levels. Countries / Regions with low average correlations are Canada, Singapore, UK and Middle East. Expect further correlation pattern shifts depending on who avoids recession.
- Sector trends: Rising default risks are concentrated in Consumer focused especially Retail, Real Estate, Pharma and traditional Telecomms. Improvements are widespread in Forestry & Paper, Basic Materials, Autos, Metals, Energy, Non-Life Insurance – and increasingly in Travel & Leisure / Hotels.
Key Global Trends
Opinions are split on the economic outlook for 2023 – some Central Banks believe that inflation has peaked and any recession will be mild. Markets are pricing in an optimistic scenario but risks remain – escalation in the Ukraine and tension in Asia are the main uncertainties.
Key Global Trends: Sovereigns lagging. Leisure, Paper, Transport positive; Retail, Pharma and Telecoms negative.
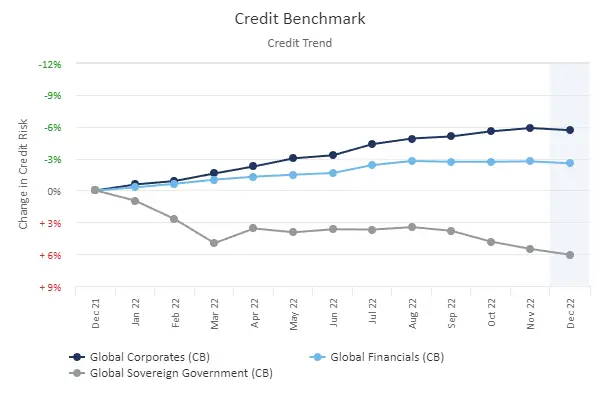
Globally, Corporates have seen a stronger post-COVID rebound than Financials – but both are plateauing.
Sovereign Governments, already grappling with COVID debts, have deteriorated in the past year. Funding rates have spiked as Central Banks tackle cost-push inflation1.
Developing countries have been particularly hard hit economically.
The Ukraine war has added a further fiscal burden, although energy cost help for businesses and consumers is likely to be tapered in spring.
Strongest improvements in recent months are in Leisure, Travel and Electronics. Major deteriorations in Consumer, especially Retail, and Pharma.
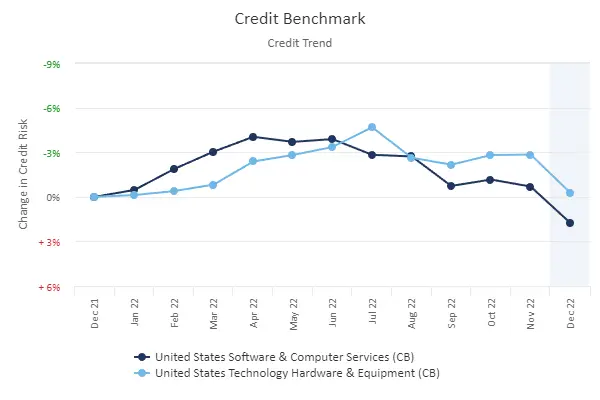
Technology: Downturn in Software from early 2022, Hardware from Q3
Technology – the economic leader for so long – now has a growing list of downsizing companies: Alphabet, Meta, Microsoft, Salesforce, Spotify, Amazon and Twitter have collectively laid off 150,000 people.
A major driver is the cost of living crisis and the end of easy money – consumers are cancelling subscriptions, and social media based firms are struggling to keep users and make up for lost advertising revenues. But content automation within the technology sector – symbolized by rapid popular adoption of ChatGPT – may be another driver.
Financials and Property
Although Financials saw some COVID-related credit downgrades in 2020, they were muted compared to the impact on Corporates.
But recent deterioration has flipped the balance of US upgrades vs. downgrades back to negative. Major banks have started layoffs, after shrinking M&A volumes and downturns in consumer lending. JP Morgan has gone a stage further, reserving against possible bad debts for this year. The charts below show some key trends.
Financials – GSIBs, CCPs, Specialized Lending: Deterioration?
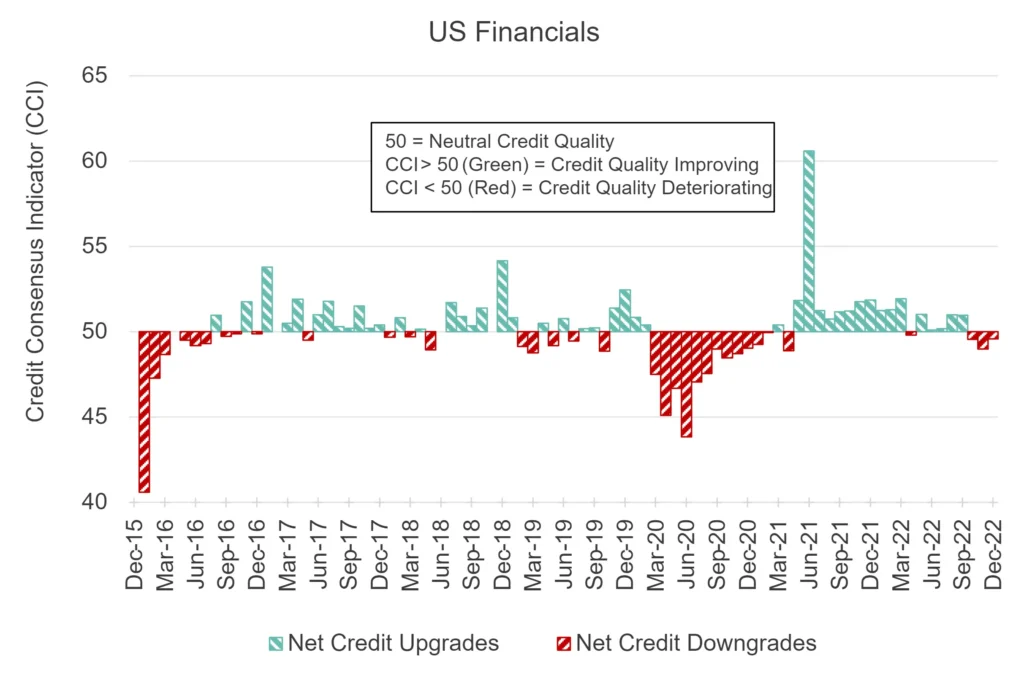
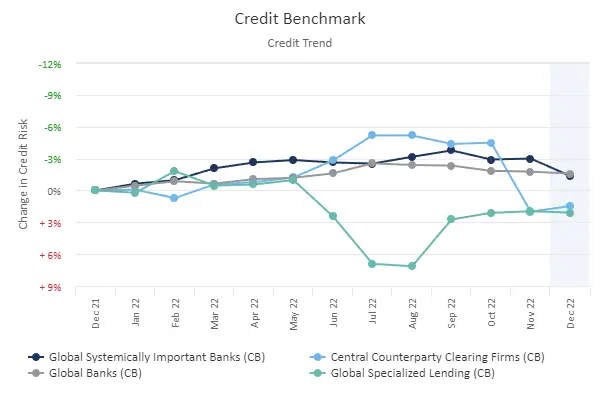
The upper chart shows that US Financials were not immune to the COVID-related wave of downgrades, but they recovered sharply in 2021. This has now run out of steam; of the four negative balances in 2022, three were in the last two months.
The lower chart shows modest but consistent credit deterioration for Global Central Counterparties and even for Global Systemically Important Banks – this mirrors regulator concerns that banks need to reserve more and monitor lending books more closely.
For Global Banks overall, the trend is flat, with concerns focused in the illiquid and often unrated segments: Global Specialized lending has been volatile but shows a marked deterioration in the past year.
After Bonds and Equities, Property is now the third largest asset class held by mutual funds; banks and insurance companies also have significant exposures. US Mutual Fund (ex-money market funds) net inflows were negative in 2022, highlighting the liquidity challenges for heavily exposed funds. The chart below shows the proportion of mutual funds in the highest credit category over time – this has dropped in recent years but has staged a sharp rebound in the past two months.
Credit Risk for Mutual Funds with Exposure to Property: Highest quality cohort
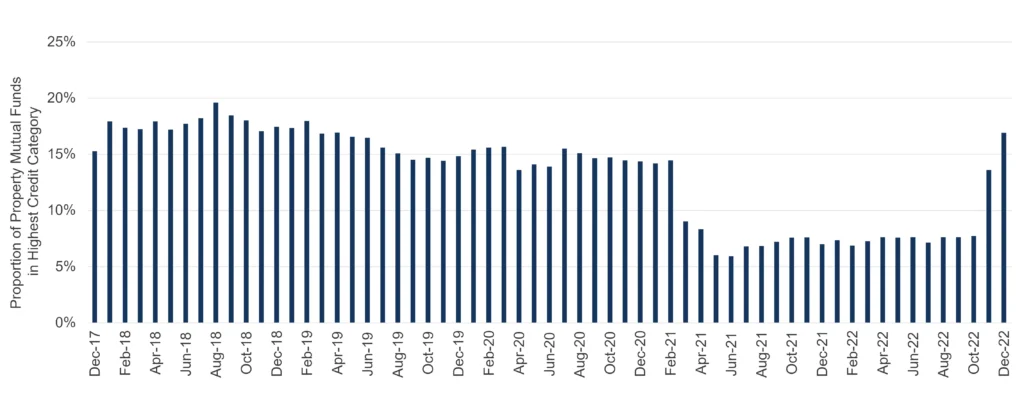
Mutual Funds are typically very good credit risks, but those with exposure to Property showed a trend drop in credit quality – from 15% – 20% in the period 2017 -2021, dropping below 10% in 2021 before rebounding in recent months: it is possible that some property-focused mutual funds have adjusted their portfolios.
Credit Index Risk Scores
COVID and the Ukraine war have had far-reaching impacts on patterns of demand and supply. Across the winners and losers, the net credit impact is not always obvious. Credit Consensus data now includes more than 1,000 credit indices covering various type, geography and industry / sector combinations. The table below shows one example of how these can be used to track credit shifts across these dimensions.
Credit Index highest risk scores, Dec 2022: Africa and North America feature heavily
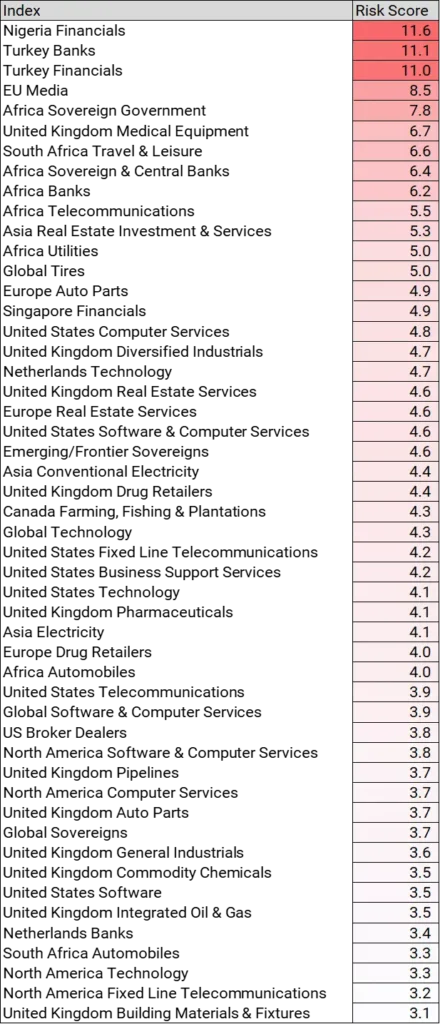
The table lists the 50 highest risk consensus-based indices, based on three risk factors:
- Proportion of constituents in credit categories b and c
- Percent change in default risk in the past month
- Percent change in the 6m trailing volatility of the index average PD.
These are normalized2 and summed. The rationale is this: if sector PDs are increasingly volatile and trending higher, downgrades are likely and higher default rates are a possibility, especially if the sector has a high proportion of low quality constituents.
African indices dominated the list in late 2022, and they continue to feature heavily.
French Retailers top the list, due to rising default risk and increasing volatility, but with just 28 constituents this may be overstated.
There are now a lot more North American / US indices, more continental European indices, and fewer UK indices.
Global Sovereigns now appear, with African Sovereigns as a stand out.
African Sovereigns had a difficult 2022: Ghana and Zambia are in default, and there are looming 2023 funding problems for Chad and Ethiopia.
Credit Volatility
Elevated, but below COVID highs. Currently suggesting a 25% to 35% increase in defaults, could rise during the year.
Credit indices can also be used to track volatility of default risks, which is a leading indicator for increasing transitions – upgrades, downgrades and defaults. The chart below shows the 99th percentile of 6 month trailing PD volatility, measured across more than 1,200 credit indices.
Credit Volatility: Elevated, but well below 2020 peak
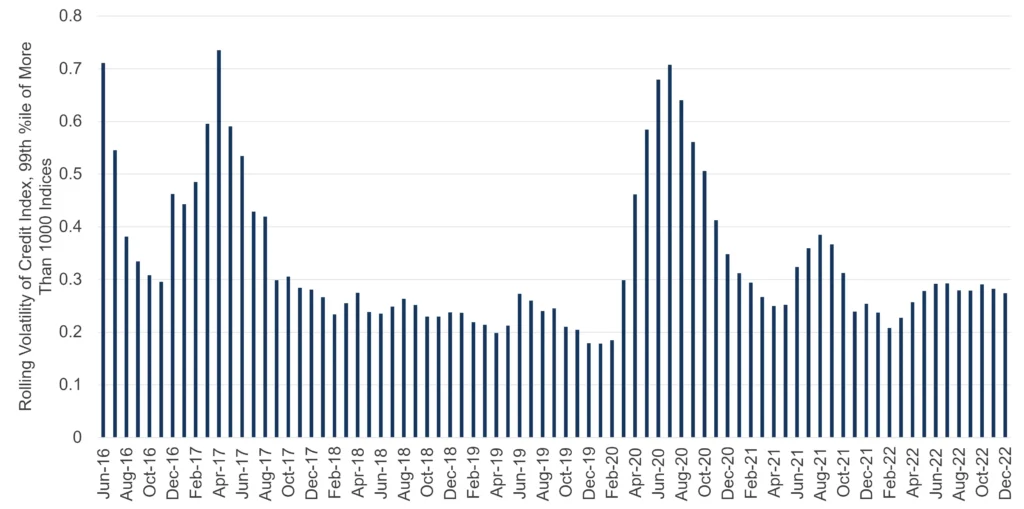
The largest credit volatility spikes are in early 2016 and 2017, followed by two COVID waves in 2020 and 2021.
Volatility trended higher again in early 2022, but is currently stable. This will be a key indicator in 2023.
As an approximate guide, if credit index volatility doubles across all credit categories, then so does the proportion of observed downgrades and defaults. With the more volatile (typically higher PD) credit indices about 25% to 35% above their baseline, it is likely that 2023 will see a significant increase in non-investment grade downgrades and defaults. The scale of the projected increase is less pessimistic than the main agencies, so this metric will be closely monitored this year.
The chart below shows average credit volatility across a range of credit indices, sorted by country.
Credit Volatility, Corporates by Country: France, India and China are high; Australia, Canada and Japan are low
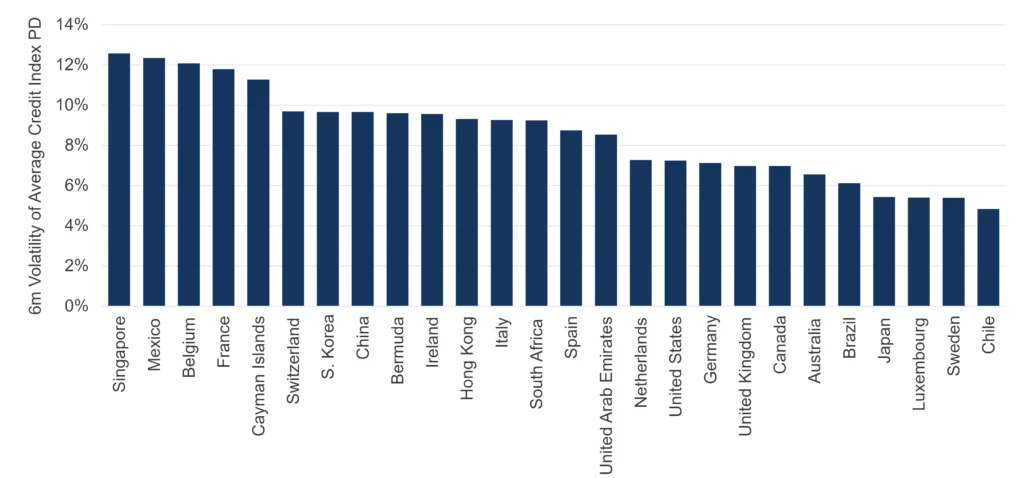
Singapore, Mexico, Belgium, France and Cayman Islands have the highest volatility in terms of corporate default risk.
Chile, Sweden, Luxembourg, and Japan are lowest.
The UK and US are below average, close to Netherlands, Germany and Canada.
Credit volatility will partly reflect the credit mix in each country and will be partly driven by the number of constituents in each index; but changes in this chart over time will give a strong indication of future downgrade and default trends.
Correlation matrices shown below are based on credit index monthly changes. During the height of the COVID pandemic, correlations were very high as banks turned cautious on large sections of their loan portfolios. In the past 12 months, correlations have been dropping.
Corporate credit correlations by geography: dropping as COVID recedes; new divergent patterns emerging
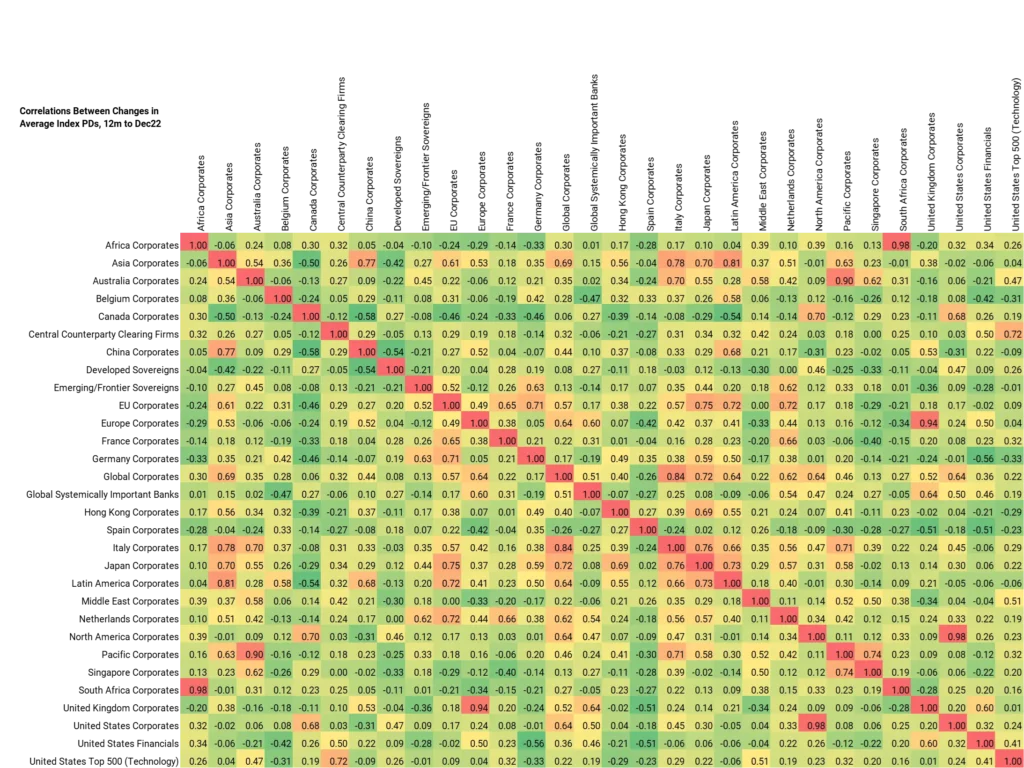
Many correlations have turned negative, indicating divergent directions for some country pairs. For example EU Corporates and Canadian Corporates now show a large negative correlation, with the Ukraine war as the main driver.
The following matrix shows Global Industry / Sector correlations for the same recent 12-month period.
Credit Correlations by Industry: Beverages, Distillers, Drug Retail, Delivery, Containers and Industrials decouple from Global Corporates.
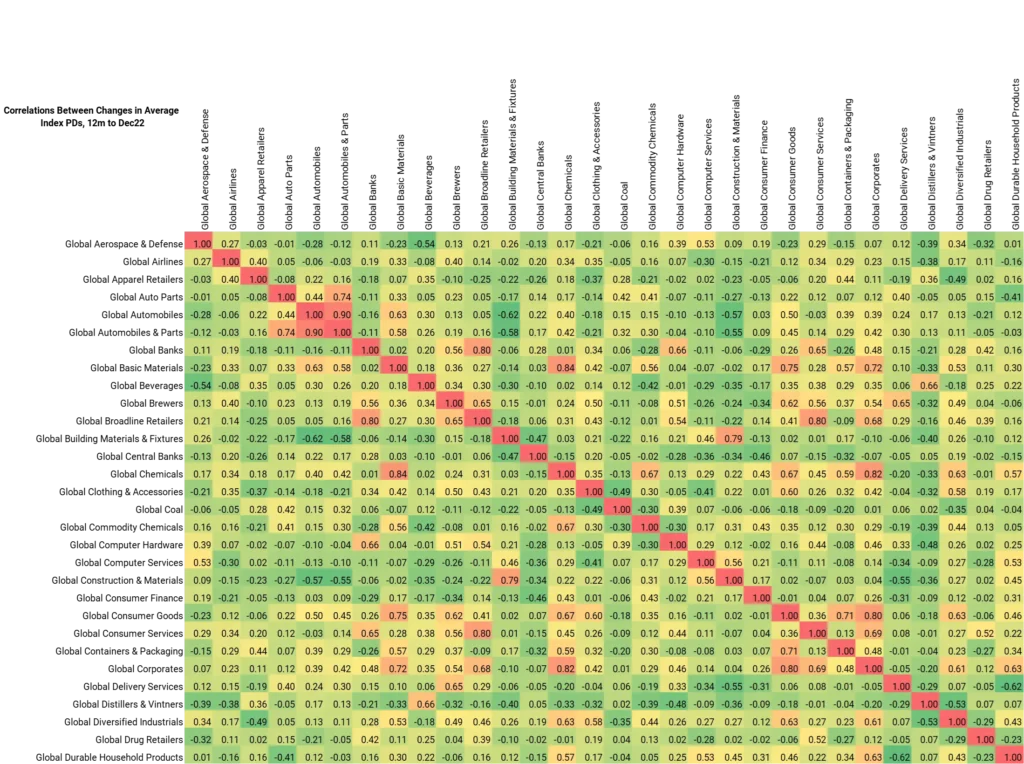
There are fewer negatives, but – for example – Brewers, Distillers, Industrials and Drug Retailers have decoupled from other sectors. Basic Materials are currently very highly correlated with Autos and Autoparts.
CB Excel tools are available to estimate these matrices for different sets of credit indices and different time periods. Contact us to request access to the CB Excel Add-In.
Conclusion
Despite a backdrop of continued geopolitical risk, lenders and borrowers are focused on inflation easing and slower rate hikes. Europe has adapted to Russian gas blackmail by sharing energy and opening up to US LNG. Energy and commodity prices are generally dropping, China is reopening, tourists are travelling, leisure and recreation are recovering. Countries are investing to tackle climate change, reshape infrastructure, and diversify supply chains – good for basic materials, chemicals, electricals and heavy construction.
But even if any recession in 2023 is shallower than initially feared, higher interest rates will be tough for smaller, consumer-focused, heavily indebted firms especially if they lack pricing power. Also at risk are specialized lenders and property focused firms that rely – directly or indirectly – on cheap funding. Larger companies, with long term funding or strong balance sheets, pricing power and less consumer dependence are likely to ride out 2023.
CB Excel workbooks are available upon request to calculate monthly correlations between indices average PD changes, including options to calculate for different sub-periods. Please use the below form to request a copy of a correlation matrix workbook:
1China, Japan, and Switzerland were the only majors to keep inflation under 5% in 2022.
2As z-scores i.e. (x(i) – mean(x))/stdev(x)

