A credit rating transition matrix shows, for a group of companies, the proportion that migrate from one credit rating category to another over a set time period. For example it could show the proportion of firms with rating AA that migrate to AAA, A, BBB, BB, B and C, plus those that remain in the AA rating category, in the course of a single year. For some use cases, it also includes a Default column to show the proportion of firms that default.
Use cases for credit rating transition matrices include calibration of default risk term structures, pricing of bonds and other credit-risky instruments and asset-liability stochastic projections. This page focuses specifically on their use for short term credit risk portfolio management and optimization.
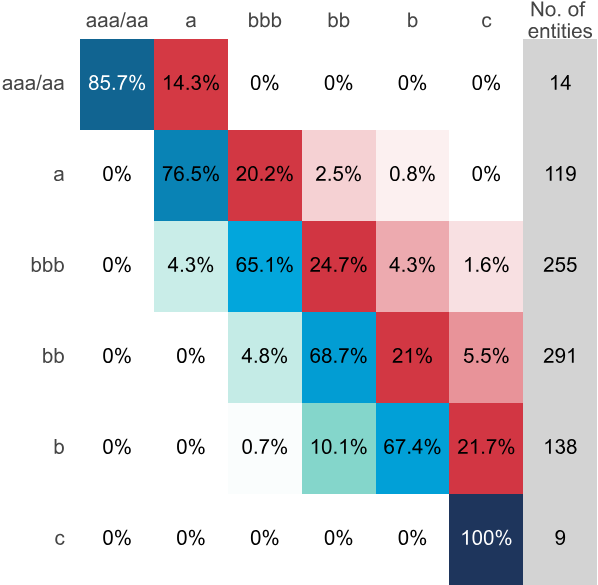
Sample credit rating transition matrix: North American Consumer Services during Covid downturn (February 2020 – February 2021)
Credit rating transition matrices are key components in default models and credit portfolio management, but calibration can be a challenge. The simplest approach tracks actual credit migrations for a cohort of names over a specified time period, but this has the drawback that smaller industries or short time periods may be subject to high sampling variation and outliers; and even large samples can show persistent anomalies.
This page describes a more generic approach with worked examples using large samples of consensus credit ratings from the Credit Benchmark dataset (e.g. all Corporates) for multiple time periods. It shows how generic credit rating transition matrices can be adapted by credit cycle data to derive robust, time-varying and industry-specific credit migration probabilities.
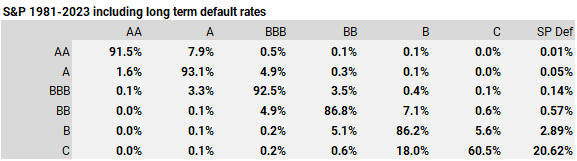
S&P’s annual default and migration study for 2023 comprehensively documents 42 years of credit rating history. For example: S&P Global Corporates data shows that in an average year, 87.63% of S&P AA-rated Global Corporates do not transition to another 7-category rating in the same year; 6.40% of the BB-rated Global Corporates downgrade to B in the course of an average year.
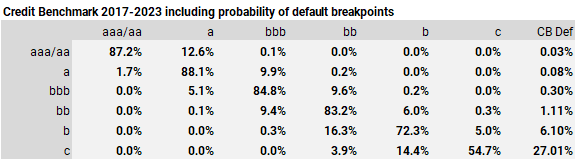
The Credit Benchmark consensus credit rating equivalent has a shorter history but a larger sample. The tables below compare average one-year migrations for 6 credit rating categories (AAA/AA, A, BBB, BB, B, and C*.)


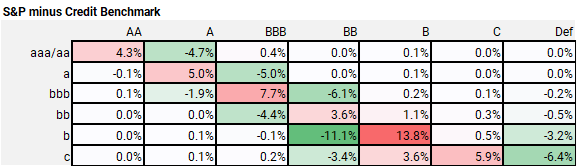
The differences are larger in the lower right high yield grades**; Credit Benchmark consensus credit rating data shows fewer firms remaining in the same credit rating category (despite the shorter time period). Consensus credit rating data especially shows significantly more upgrades from B to BB. So the overall credit migration rate (+/-) is noticeably higher in Credit Benchmark’s consensus credit ratings. There are a number of possible reasons for this. Credit rating agencies frequently adjust rating “Credit Watch” and “Credit Outlook” status without changing the actual credit rating, whereas bank lenders will change the actual probability of default. Credit agency ratings are opinion based, so their credibility hinges on longevity and stability. Bank internal ratings need to reflect prevailing risk levels at various time horizons ranging from Point-in-Time to pure Through-the-Cycle.
* Adjusted for the removal of the Default (“D”) and Not Rated (“NR”) columns as well as combining the AAA and AA rows/columns to reflect the very small universe of AAA names.
** Credit Benchmark consensus credit data includes more firms with withdrawn ratings or those that have chosen not to be rated.
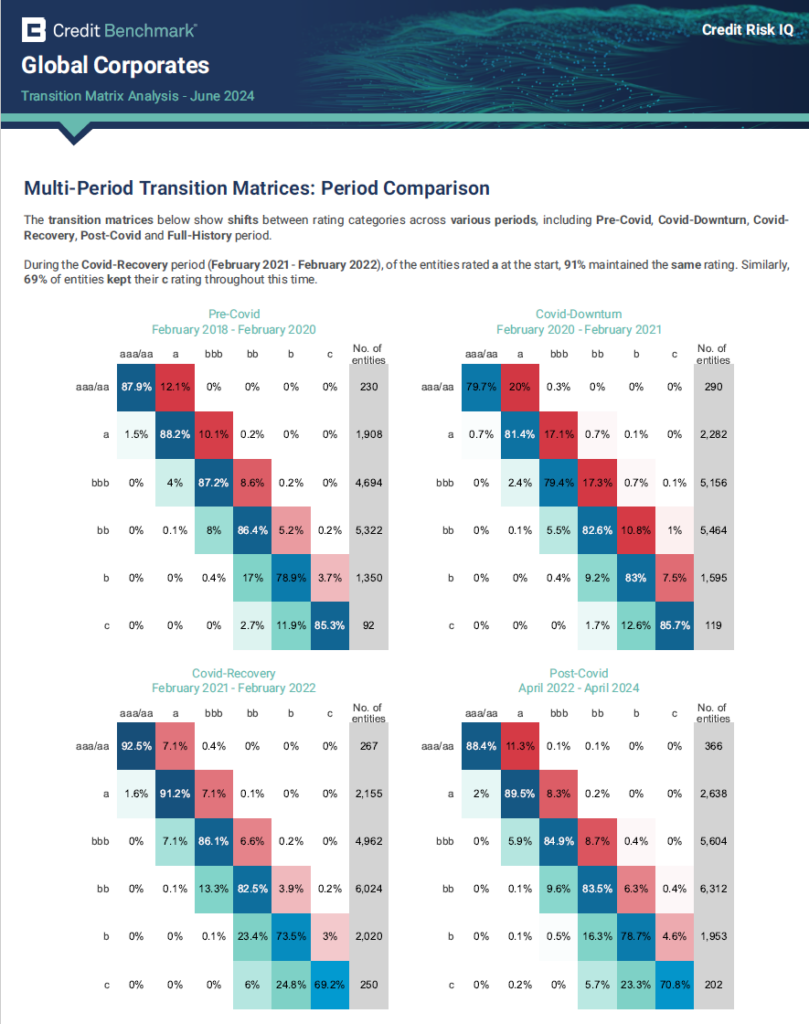
Credit rating transition matrices change over time and can show considerable industry variation*. The matrices below show the scale of this over the Covid era for Global Corporates.
For Global Corporates, the credit downturn phase (top right matrix) shows large values on the first off-diagonal of the upper right triangle. The largest values are in the higher credit rating categories. The credit upturn phase (lower left matrix) shows large values on the first off-diagonal of the lower left triangle; the largest values are in the lower credit rating categories. The pre- and post-Covid years are skewed to credit upgrades.
Similar free matrices are available for Global Financials, as well as for specific geographies, industries and sectors via Credit Benchmark’s Credit Risk IQ portal. 5,000+ free industry reports are available monthly via Credit Risk IQ.
* See S&P standard deviation statistics in the first table of this report.
Credit cycle data offers a simple but powerful way to estimate robust, time-varying credit rating transition matrices for a broad range of industries and sectors.
A key advantage of Credit Benchmark’s consensus credit ratings data is the large number of probability of default risk updates every month, and these include small changes in risk estimates – below the threshold for actual rating changes. This gives a form of early warning that major credit rating transition matrix changes may be in the pipeline. The chart below illustrates this.
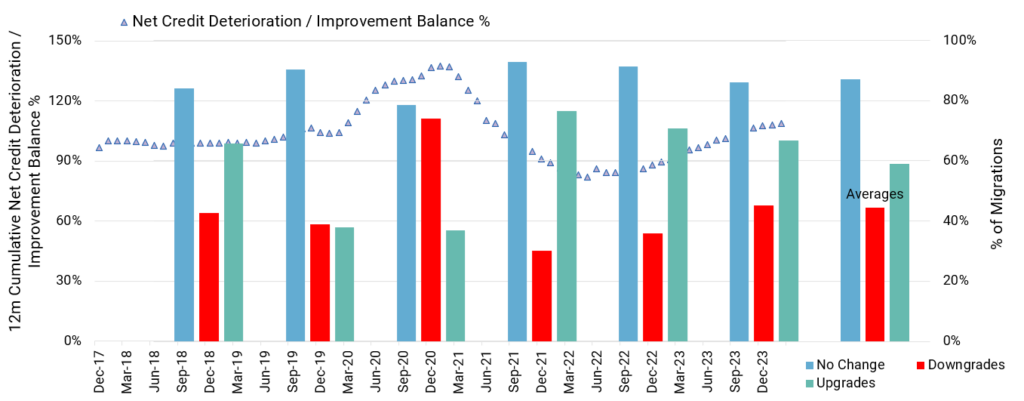
The blue triangles show the credit cycle, measured by rolling 12-month net credit deterioration/improvement balances. The plotted line is the 50th percentile of this metric across 1200 indices derived from Credit Benchmark’s consensus credit rating data. The bars show key statistics for the end-year credit rating transition matrix – blue shows the average % of Global Corporate entities that are unchanged in credit quality, green shows total credit upgrades, and red shows total credit downgrades for each year. The final column averages these over the 6 years 2018-2023.
Covid brings a spike in credit deteriorations (i.e. probability of default changes), rising to 140% of the total number of names (i.e. some names show multiple credit risk rises). In 2019, Upgrades and Downgrades (i.e. credit rating category changes) were in balance; by the end of 2020, Downgrades outnumber Upgrades by 2:1. The net credit deterioration/improvement moved quickly in 2020, flagging up the pending credit rating transition matrix change. Monthly consensus credit ratings data makes it possible to predict future credit rating transition matrix changes with a high level of confidence.
A credit portfolio manager can measure current industry net credit deterioration/improvement vs. its long-term range, with the long run average as a baseline. The distance above or below the baseline relative to the maximum or minimum net credit deterioration/improvement provides the weight for a linear combination of the long run credit rating transition matrix and the Trough or Peak credit rating transition matrix, giving a credit cycle adjusted credit rating transition matrix for that industry in the current time period. This is a simplified version of the z-factor approach.
For default rate forecasting, Credit Benchmark uses separate credit rating transition matrices for Corporates vs. Financials; but we assume that large sample credit rating transition matrices can be used for most corporate industries. Observed differences are mainly due to sampling variation or industry credit cycle timing differences. The next section illustrates the calculations.
A sample portfolio consists of entirely of US Technology obligors within Credit Benchmark’s consensus credit ratings dataset. Portfolio single name exposures are aa=5%, a=17%, bbb=25%, bb=35%, b=15%, c=3%.
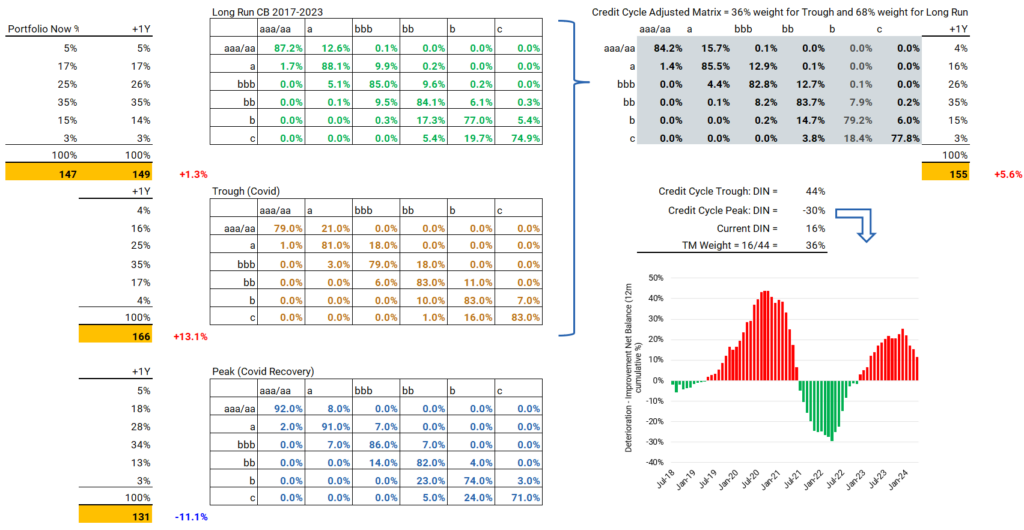
Using current credit exposures as weights for the S&P long term Observed Default Rates gives portfolio probability of default risk of 147 Bps (top left). Using the Long Run consensus credit rating transition matrix, it will rise 1.3% in the next year to 149 (next column, top left) as a result of credit migrations. This assumes no portfolio changes or movements in the expected default rate per credit rating category during the year.
During the Covid pandemic, the equivalent default rate would rise 13% to 166 Bps (middle second column, halfway down). During the recovery, it would drop 11% to 131 Bps (Second column, bottom right). Currently the net credit deterioration/improvement is 36% of the historical high (shown above credit cycle chart), so the credit rating transition matrix used is a weighted average of 36% of the Trough transition matrix and 68% of the Long Run transition matrix. This implies a 6% increase in the coming year to 155 Bps.
The net credit deterioration/improvement chart suggests that the rate of credit deterioration is set to drop relative to credit improvements. Projecting this out by 12+ months would likely show a drop in prospective default risk vs. current. Similarly, an industry which was currently in the green but heading into the red could show a dramatic increase in projected default risk. Some industries lead or lag the main credit cycle.
This approach can be used for every industry in the portfolio and will have a direct bearing on portfolio decisions, including Significant Risk Transfer (SRT) deal structures.
This example quantifies the combined benefit of industry net credit deterioration/improvement metrics and large sample credit rating transition matrices.
The table below shows the structure of a hypothetical US credit portfolio weighted by consensus credit rating categories.
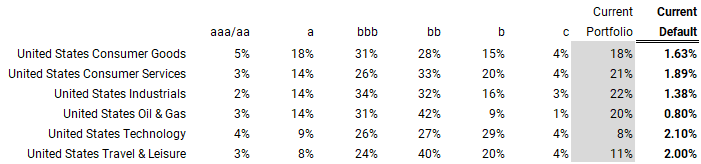
Current probability of default rates for each industry listed in the last (bold) column are derived from the product of the credit rating category weights and long-term S&P observed default rates – Oil & Gas are lowest, and Technology is highest. The portfolio exposures in the second last (grey) column partly reflect these risk levels – light in Technology and heavy in Oil & Gas.
The credit-cycle adjusted long term global corporate transition matrix can be used to give the projected 1-year ahead credit structure for each industry; and this gives a revised set of future expected default rates:
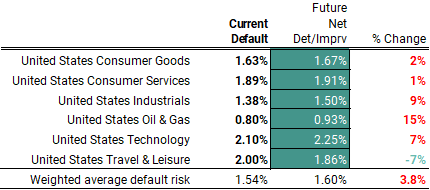
Adjusting for credit cycles, all industries apart from Travel & Leisure are projected to increase over the next year. The weighted average portfolio risk (bottom row) shows an increase of 3.8%, mainly due to the high Oil & Gas exposure, which has the lowest risk level but the highest projected risk increase.
This analysis can be taken further, by allowing for 7-year correlations between credit cycles:
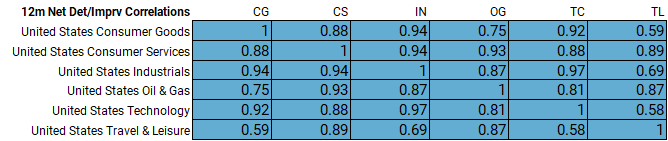
Oil & Gas and Travel & Leisure show a lower correlation with Industrials compared with other Industries.
The table below adds a row for correlation adjusted risks:
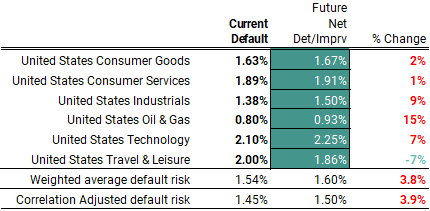
The portfolio risk level has dropped from 1.54% to 1.45% (with correlations <1, some risks cancel out) but the projected increase is slightly higher, rising 3.9% from 1.45% to 1.50%.
Credit portfolio managers may have scope to adjust their exposures. That makes it possible to hedge against expected future risk increases. The table below shows an optimal set of exposures that leave estimated future risk unchanged from the current level.
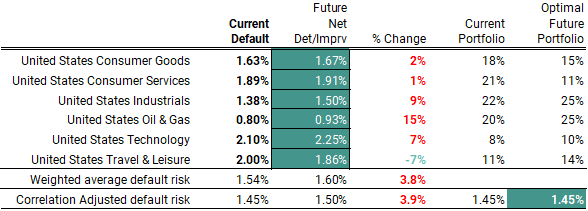
Despite rising credit risk in most industries, the new portfolio has the same level of overall risk as the initial allocation, offsetting the deteriorating transition pattern over the year. This is achieved by allocating more to Industrials and Oil & Gas (rising, but low) and away from Consumer industries, especially higher risk Consumer Services. Travel and Leisure is high but falling and receives an increased allocation; Technology is high and increasing but has a small increase in allocation to balance reductions elsewhere. This shows that there is scope to achieve a lower risk level despite the increasing probability of default risk in most industries.
Credit Benchmark produces free credit rating transition matrices on 500 different geographies and industries. You can also build transition matrices on your own portfolios, using historical consensus credit cycle data on 100,000+ obligors. Get in touch below for a complimentary analysis of default risk on your portfolio.
The matrices in the previous examples do not include firms that transition to “NR” (not rated) or “D” (Default), but for many use cases (e.g. term structures) it is necessary to add a default column.
The Credit Benchmark credit rating transition matrix equivalent below uses 1-year probability of default midpoints for each credit rating category. These are typically higher than the median observed rates (“conservative margin”) but are within the historic observed ranges.
The S&P credit rating transition matrix below includes median long term observed default rates for each credit category; these and the preceding columns are normalised to give row totals of 100%.
The differences below show the same pattern noted earlier in this report – consensus credit rating data generally shows higher migration rates in both directions.
S&P also publish “Not Rated” (NR) rates. These withdrawn ratings cover defaults, takeovers, changes in ratings provider. They are, however, correlated with historic default rates. Credit Benchmark consensus credit rating data includes dropped names, and these may be useful as a time-varying default proxy.
Credit Benchmark offers entity-level Credit Consensus Ratings on over 100,000 counterparts and borrowers globally, alongside an extensive suite of analytical tools and products.
Please contact us to request a full service demo and learn how Credit Benchmark helps risk professionals manage their capital and risk more effectively and efficiently.
Credit Benchmark brings together internal credit risk views from over 40 leading global financial institutions. The contributions are anonymized, aggregated, and published in the form of consensus ratings and aggregate analytics to provide an independent, real-world perspective of credit risk. Risk and investment professionals at banks, insurance companies, asset managers and other financial firms use the data for insights into the unrated, monitoring and alerting within their portfolios, benchmarking, assessing and analyzing trends, and fulfilling regulatory requirements and capital.
Please complete the form below to arrange a demo.