After 15 years of steady growth, the $1.4trn Leveraged (and often “Cov-Lite”) Loan market is adjusting to higher interest rates.
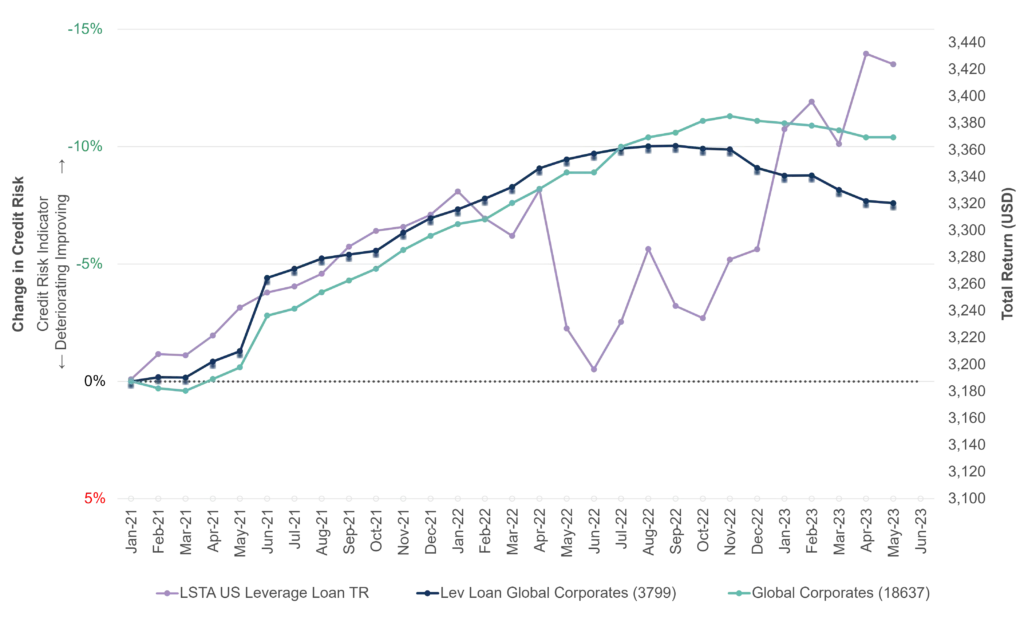
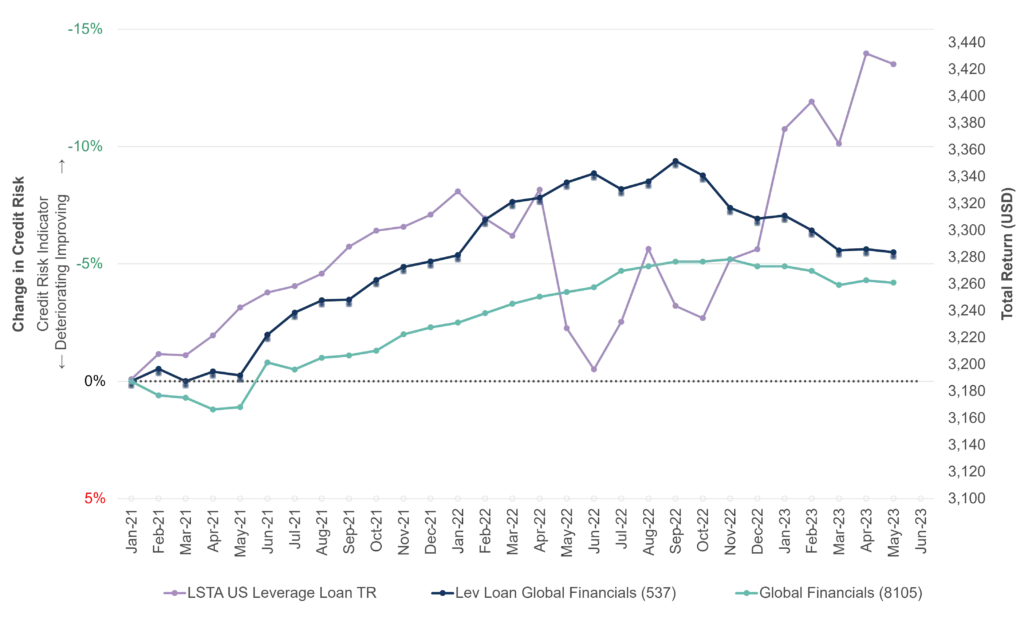
The 100 constituents of the Morningstar LSTA index cover $300bn of outstanding loans. After a drop in 2022, the 2023 total return (TR) of YTD 4.2% is above the long run average. The chart below plots cumulative changes in the LSTA TR index against issuer credit risk for broader1 corporate (top) and financial (bottom) universes, since Jan-2021. The global corporate and financial credit indices are included for comparison.


In recent months, Leveraged Loan issuer credit has deteriorated faster than their broader credit indices, after both posted steady improvements in 2021 and 2022. Over the same period, the LSTA index has risen 10%, given up all those gains in Q3 2022, but has now exceeded its previous peak. The total return index is much more volatile than the issuer credit indices; the latter usually change slowly with fewer but significant turning points.
After a stellar performance over the past 12 months, the Leveraged Loan total return index is diverging from its respective credit indices. If consensus credit risk continues to deteriorate, it might prompt investors to review their portfolio choices.
1 The Credit Benchmark Leveraged Loan universe covers more than 4000 issuers of Leveraged Loans, in multiple regions and industries, both public and private.
