Download the latest Industry Monitor below.
Credit Benchmark have released the end-month credit industry monitor for end-June, based on the final and complete set of the contributed credit risk estimates from ~40 global financial institutions.
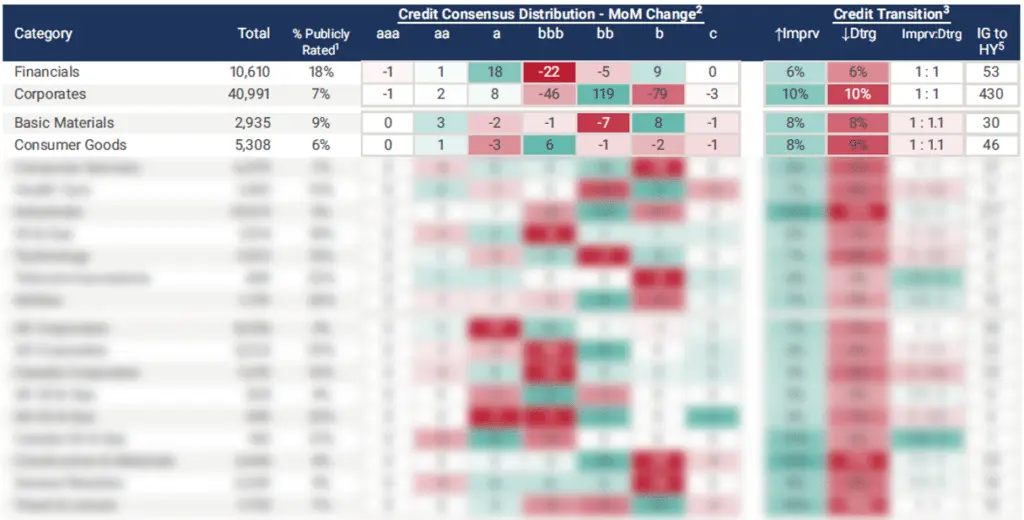
Credit Benchmark covers 40,991 non-financial Corporate firms, 93% of which are not rated by a credit rating agency. This month, Corporates saw balanced credit movement, with an even number of improvements and deteriorations. Financial firms (of which we cover 10,610, 82% of which are not publicly rated) similarly showed credit neutrality, with a 1:1 improvements to deteriorations ratio.
Industry Level Credit Movement:
At the industry-level, credit movement in either direction was mild, with most categories showing close to neutral credit quality. Of those biased towards credit deterioration, Heath Care firms (1,482, 90% unrated) and Technology firms (1,522, 85% unrated) both showed a ratio of 1:1.2 improvements to deteriorations. Telecommunications (469, 78% unrated) showed the strongest positive ratio, with 1.7:1 improvements to deteriorations. The next strongest performer was Utilities (1,701, 74% unrated), with a ratio of 1.3:1.
Sector Level Credit Movement:
Amongst the sectors, Canada Oil & Gas (160, 79% unrated) outperformed its’ US and UK peers, with a positive credit ratio of 1.9:1 improvements to deteriorations. The US group (459, 67% unrated) were slightly in the red, with a ratio of 1:1.2 improvements to deteriorations, and the UK firms (265, 96% unrated) slightly positive with a ratio of 1.1:1. Conversely, Canada Corporates (1,610, 90% unrated) showed the highest instance of net credit deterioration with a ratio of 1:1.4 improvements to deteriorations. Credit movement was otherwise fairly balanced for the sectors.
In the update, you will find:
- Credit Consensus Distribution Changes: The net increase or decrease of entities in the given rating category since the last update.
- Credit Transition: Assesses the month-over-month observation-level net downgrades or upgrades, shown as a percentage of the total number of entities within each category.
- Ratio: Ratio of Improvements and Deteriorations in each category since last update, calculated as Improvements : Deteriorations.
- IG to HY Migration: The number of companies which have migrated from investment-grade to high-yield since the last update (known as Fallen Angels).
Credit Benchmark will continue to provide regular reports on these migration rates. If you have any questions about the contents of this update, please get in touch.