The Southeast U.S.A. is in the middle of its annual hurricane season. In this blog, we look at the impact that a severe hurricane could have on a range of companies, depending on their credit risk and their geographic location.
For the past few years, hurricanes in this area have been mild and infrequent; and so far this season is following the same pattern. But such periods of calm bring new risks. Memories can be short: a house devastated by Hurricane Sandy in 2012 may now be the site of a new dream vacation home.
Normally the insurance industry will take a longer-term and balanced view of risk and return, but in today’s ultra-low interest rate environment, the search for yield is driving increased risk-taking.
For reinsurers, these trends are even more pronounced, with recently benign hurricane seasons resulting in abundant capital. According to Moody’s, reinsurers have increased their exposure to catastrophe insurance, especially in U.S. coastal zones. In addition to the more remote 1-in-250 categories they are also increasing their peak zone catastrophe risk in the 1-in-100 year categories. With these trends in mind, all the main ratings agencies remain cautious in their outlook with Moody’s and A.M. Best placing the reinsurance industry on negative outlook.
In addition to reinsurers and direct insurers, hurricanes create obvious problems for oil companies, cruise operators, hotels, transport firms and even municipal authorities who may see significant shrinkage in their tax base following a storm. A severe hurricane may be the single, rare event which pushes highly leveraged firms into bankruptcy.
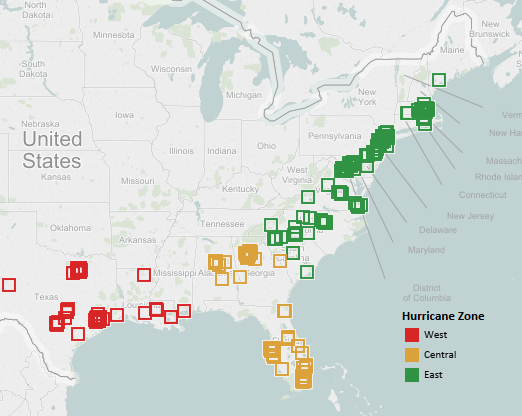
To assess this risk, the following map of the Southeast USA is divided into three color-coded regions – West (Red), Central (Orange) and East (Green) – corresponding to the main paths that hurricanes are likely to follow as they move North. The plotted squares show the distribution of various obligors in high risk industries taken from the Credit Benchmark database (which now includes detailed geographic location data.).
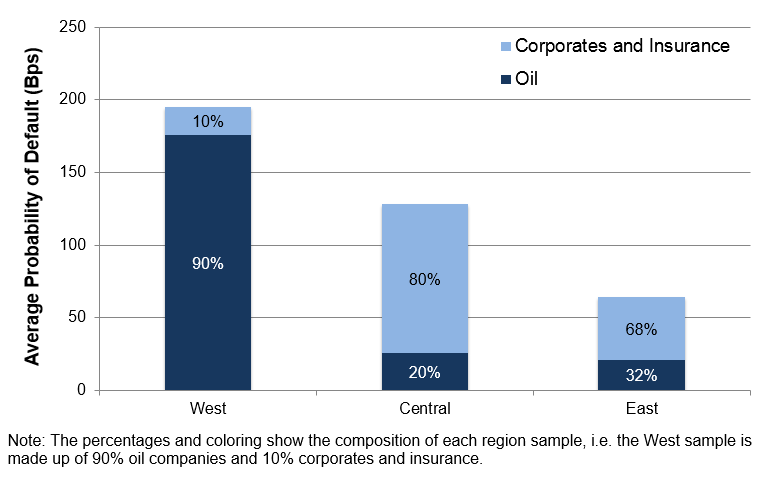
The next chart shows the average Probabilities of Default (“PD”) for a sample of companies in the exposed sectors in each of these possible paths. The bars also show the proportion of oil companies in each sample. The Western path is dominated by oil companies, and in credit terms some of these are very high risk. The Central path is dominated by corporate and financial companies with significant exposure to hurricane risk. The Eastern path is also skewed towards the corporate and financial firms.
This data suggests that the Western route appears to have the potential to cause the greatest financial damage. If hurricane activity picks up (in a year which has already set new global temperature records), then it is possible that there will be a spike in credit risks amongst companies in the most geographically vulnerable zones.