
Credit Benchmark’s consensus credit data provides an unparalleled view of Italian default risk through a robust framework of over 3,700 credit risk aggregates covering more than 18,000* Italian corporates, financial institutions, and funds. This dataset spans 20 regions, 70+ sectors, and multiple credit categories and company sizes**, with historical depth dating back to 2017.
- Italian default risks broadly track the global aggregate, but are more volatile with major differences across regions and sectors.
- After a steep deterioration, most regions and sectors are showing strong recent improvement.
- The Investment Grade Corporate aggregate has been very stable, but (unusually) led the recent improvement.
- Banks have outperformed the main aggregates, Real Estate has underperformed.
- Calabria is the worst-performing region, with Lombardy the best (and a proxy for Italian risk generally).
The bottom left chart shows recent trends for Corporates split into Italy High Yield and Investment Grade, with Global Corporates for comparison. The bottom right chart shows 7-category credit profiles by type for the Italian universe.

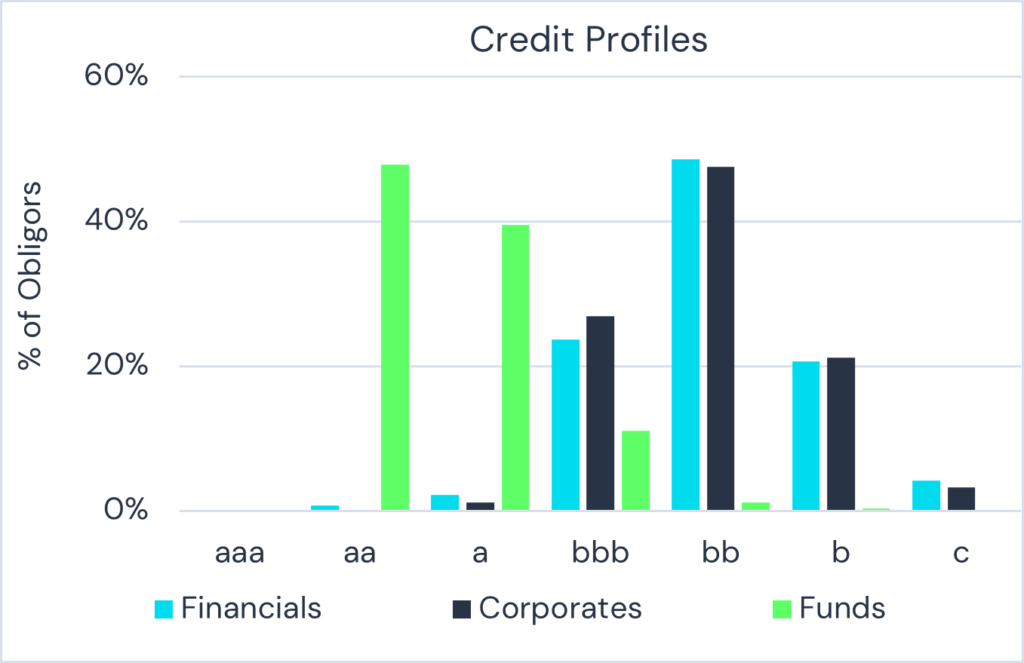
Italian corporate credit is more volatile than the global aggregate, with a significant drop in risk in early 2024 followed by a steep climb in H2. These aggregates are now recovering again. Corporate and Financial credit profiles are very similar, with the majority in the ‘bb’ rating category. Funds are nearly all IG and mainly ‘aa’ or ‘a’ (mainly mutual funds, so the ratings are similar to global mutual fund ratings).
Regional Credit Profiles
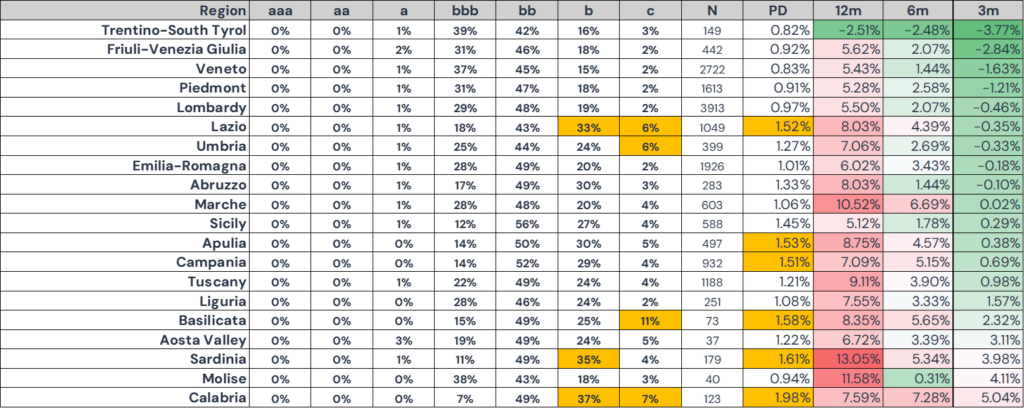
Obligors (N), Probability of Default (“PD”). Highlighted cells show b >30%, c >5%, PD >1.5%.
- Highest c%: Basilicata
- 2nd highest c%: Calabria
- Highest b%: Calabria
- 2nd Highest b%: Sardinia
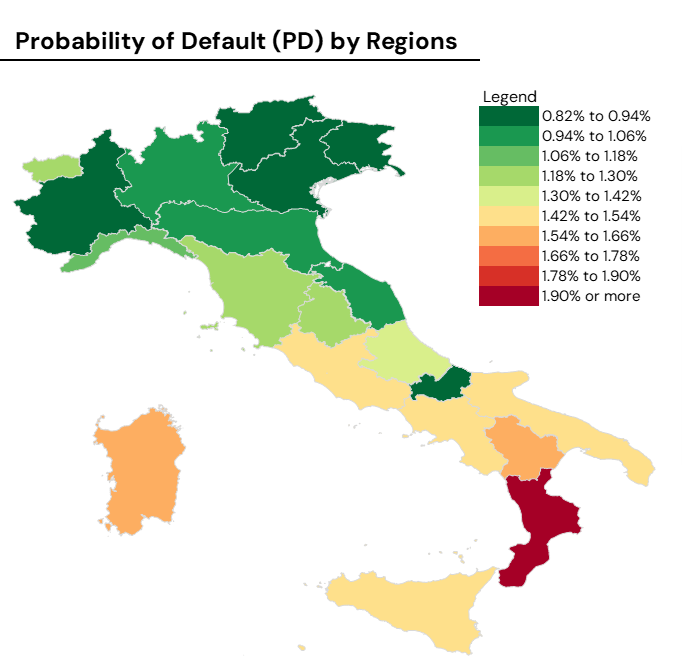
- Highest PD: Calabria
- 2nd highest PD: Sardinia
- Umbria has high c exposure but average PD.
- Campania has a high PD but b and c exposures are mid-range.
- Lowest PD: Trentino, Veneto, Piedmont, Friuli.
- Lowest c%: Piedmont.
The table above shows regional credit profiles, obligor numbers, and average default risks.
The PD changes in the last three columns show increasing risk in all regions except Trentino over the past 12 months. The 6 month changes also show more modest increases, but the (ascending) 3 month column shows risk dropping in 9 of the 20 regions.
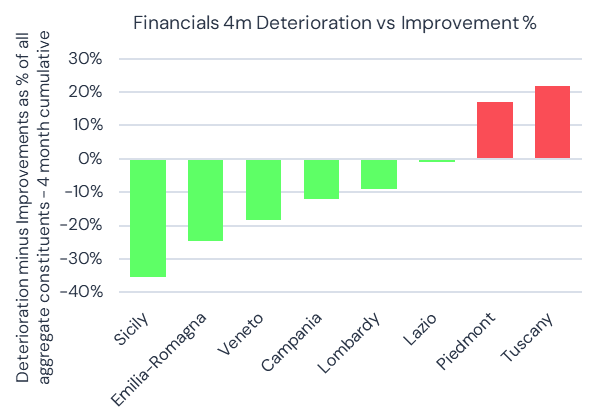
The following charts show the 4-month % balance between credit deterioration vs credit improvement for Corporates and Financials by region.
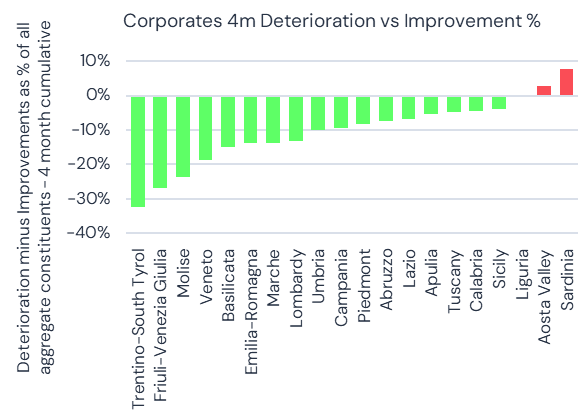
Most regions show a 4-month bias to improvements, apart from Aosta and Sardinia. Fruili, Molise, Trentino and Veneto all show strong improvement.
Financials show rising risks in Piedmont and Tuscany, but major improvements in Emilia-Romagna and Sicily.
Corporate Segmentation and Sector Focus
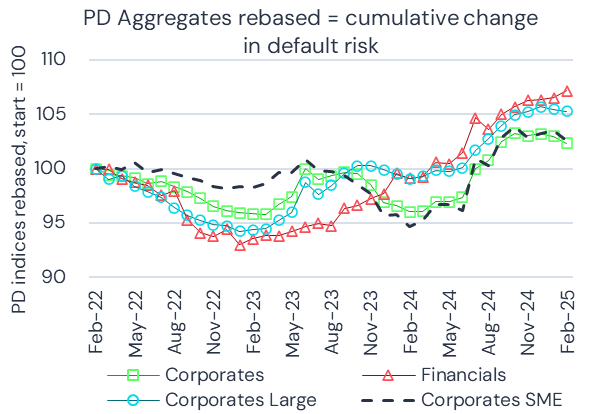
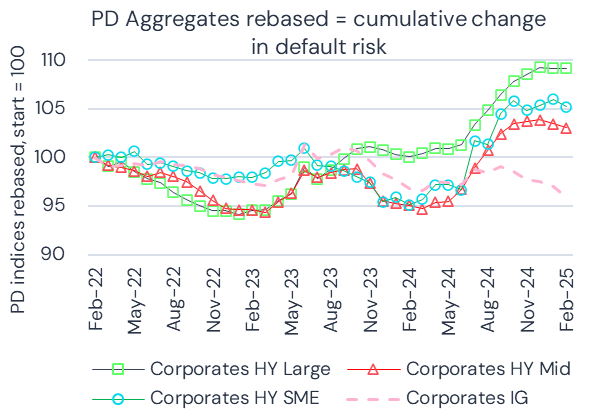
The bottom left chart shows cumulative PD change for Corporates vs Financials since early 2022. Financial risk is still rising but Corporate risk has been improving since Q4 2024. Large Corporates deteriorated more than SMEs, but both are now recovering. The bottom right chart shows Large, Mid and SME for High Yield (“HY”) companies (Corporates and Financials). Again, large firms show the greatest deterioration, Mid show the least, with SME in between. All three show recent stabilization / recovery and could start to close the gap with Investment Grade (“IG”).
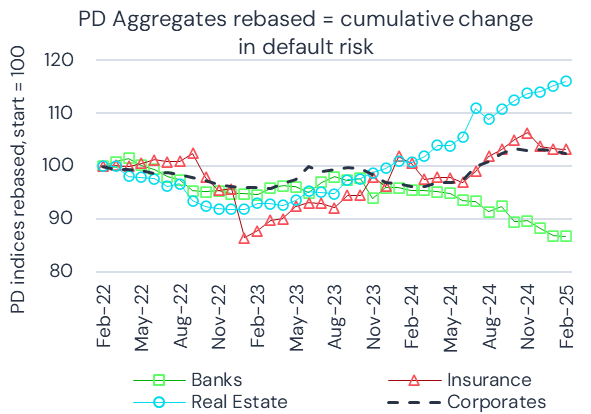
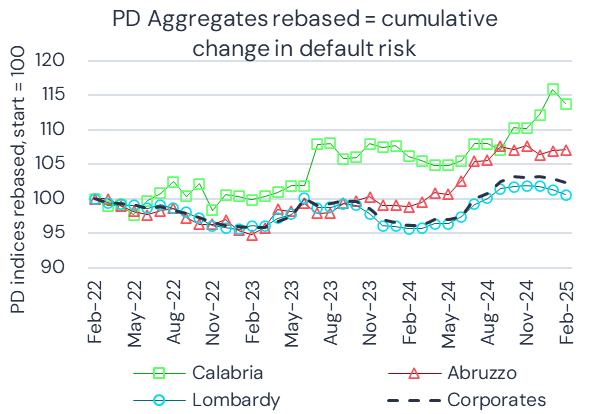
The bottom left chart shows that within Financials, Real Estate risk is up 15% since 2022, while Banks have improved by 15%. Insurance has tracked Corporates. The bottom right chart shows that Calabria has been the most volatile region with a near 15% deterioration since 2022, while Lombardy has been stable and shows no net change in risk; its is also a proxy for overall Italian Corporate risk. Abruzzo has tracked midway between these two aggregates.
The table below shows aggregates with the highest 4-month deterioration. It also show significant PD deterioration over the past 12m, 6m and 3m.
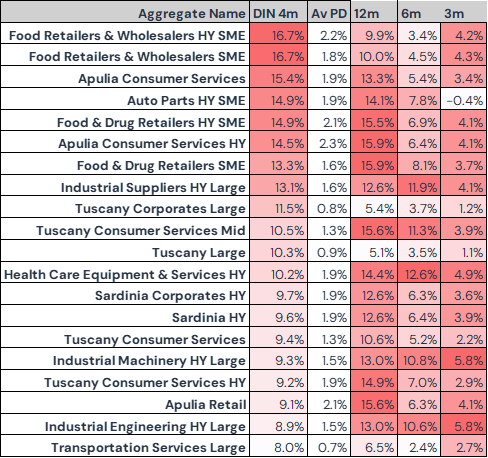
Indices with the sharpest recent deterioration are concentrated in Apulia, Sardinia, and Tuscany, particularly in Retail, Food & Drug Retail, and Consumer Services.
Large HY entities in Industrial Engineering, Transport Services, and Industrial Suppliers also appear among the underperformers.
Half of these indices are High Yield, and only one is Mid-sized—Large and SME segments dominate.
Conclusion
Despite trailing the broader EU bloc on growth, current account balance, and fiscal indicators, Italy’s recent credit data suggests emerging strength, consistent with the European Commission’s more optimistic 2025 outlook.
Credit improvement will depend largely on the success of the Recovery and Resilience Plan, with consumer spending seen as the primary engine of growth.
While US tariffs may challenge Italian exports, increased intra-EU trade could provide unexpected support.
Notes on Report & Data
The analysis within this report uses data that was produced prior to the recent US tariff announcements, but the impact of these policies are anticipated to be reflected in upcoming data updates. Please get in touch for more information or detailed analysis
Credit Benchmark consensus credit data is updated weekly and delivered to our clients via our Web App, Excel add-in, flat-file download and third party channels including Bloomberg, Snowflake and AWS. Advanced analytics like those found within this report are now also available for free on the Credit Benchmark website via Credit Risk IQ. 10,000+ monthly geography-, industry- and sector-specific risk reports and transition matrices are available on Credit Risk IQ.
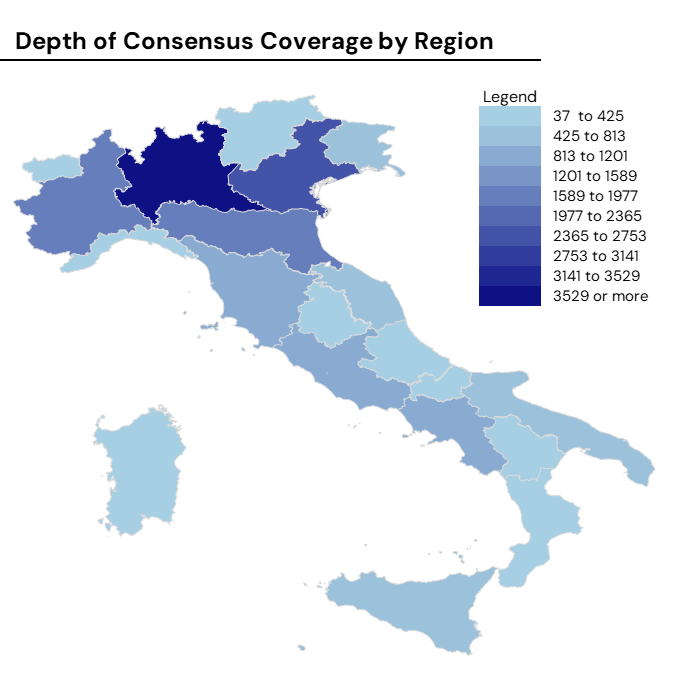
Appendix 1 - Credit Benchmark Italian Consensus Coverage by Region
Appendix 2 - Probability of Default (“PD”) by Region
Download
* Out of a universe of more than 27,000 single names with history dating back to 2015.
** Using reported entity level revenues sourced from company financial reporting