Consensus credit estimates combined with market CDS data can complement and extend existing CVA calibration.
Credit Value Adjustments (CVAs) aim to compensate for the risk of a swap counterpart defaulting before transaction maturity. CVAs are calibrated to risk-neutral Probability of Default (PD) estimates, and these are usually derived from Credit Default Swap (CDS) prices for various maturities.
However, CDS market coverage is narrowing, and individual CDS are often illiquid, volatile and subject to a range of distortions. For example, the March 2023 spike in Deutsche Bank CDS prices was mainly driven by one small trade.
Consensus credit risk estimates (used in bank risk capital calculations) are real-world one-year expected default frequencies, updated every two weeks.
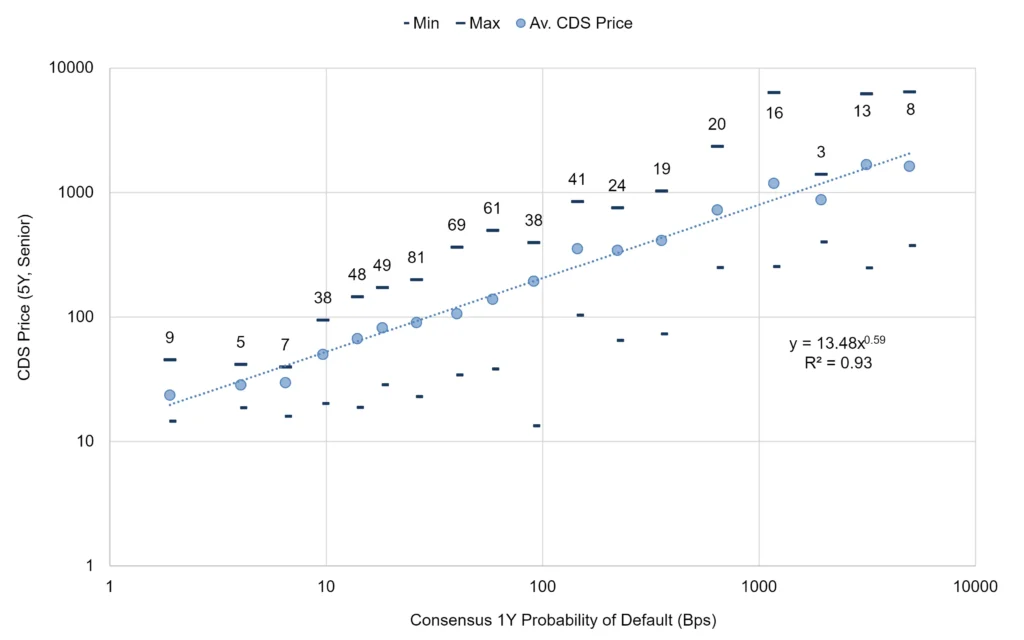
The chart below shows how real-world and risk-neutral estimates are linked. The fitted line is a benchmark for the daily PD / “synthetic” CDS price relationship. As risk premiums shift, the fitted line will rotate clockwise (lower credit risk premium) or anti-clockwise (higher premium).

This plots February 2023 real world 1-year PDs (credit category midpoints) and late February 2023 5-year Senior CDS prices (log scales), for around 500 Corporates and Financials.
PDs and CDS prices are averaged by credit category.
Min and Max markers show the range of individual CDS prices in each category1, with the issue count in grey.
With a fixed assumption for recovery rate, market implied PDs can be calculated for each point on this graph. The difference between market implied and real world PD is the risk premium in PD basis points for each credit category. Other maturities can be plotted if CDS price data is available.
From initial dataset covering issuer PDs and their associated traded CDS prices, it is possible for risk managers to estimate “Synthetic” CDS prices – and CVAs – for counterparts with no agency rating, no CDS and even no bonds.
Extension to term structures: the previous chart links the 1-year PD directly with the 5-year CDS price; this can be done for other maturities, but CDS pricing data may be sparse.
As an alternative, Term Structures can be generated from a Transition Matrix (TM). Transition Matrices derived from consensus data can be used to extrapolate one-year default risk estimates to a full term structure of longer maturities. Adding a credit risk premium (e.g. estimated using the data in the previous chart) converts this to a market implied term structure. Credit Benchmark can supply Transition matrices for 350+ issuer industries and geographies, as well as for bespoke portfolios.
Consensus credit data complements CDS data in a number of ways:
- Consensus credit ratings can be used for counterparts with no corresponding traded CDS.
- Large sample approaches shown here reduce the impact of single name CDS price volatility.
- Bank estimates are unaffected by illiquidity and one-off trades.
Enjoyed this report? If you’d like to see more consensus-based credit ratings, mid-point probabilities of default and detailed analytics on 75,000 public and private global entities, please complete your details to request a demo or coverage check:
1 Individual CDS within each category show wide price variation, reflecting differences in assumed recovery rates and liquidity in the relevant reference bond.
