Report Highlights:
- US the only economy of G7 + China group expected to show a drop in High Yield (HY) default rates in 2025 due to tax cuts, lower rates and financial de-regulation.
- China HY Corporates projected to show default rate increase of more than 40%, Japan HY Corporates more than 30%.
- Most G7 HY Financial indices projected to show smaller (<20%) default rate increases, but French and German HY Financial ranges skewed towards higher risk.
- UK Corporates and Financials show limited impact in 2025 but 2026 more challenging.
Table of Contents
Overview: G7 + China Macro Risk Landscape
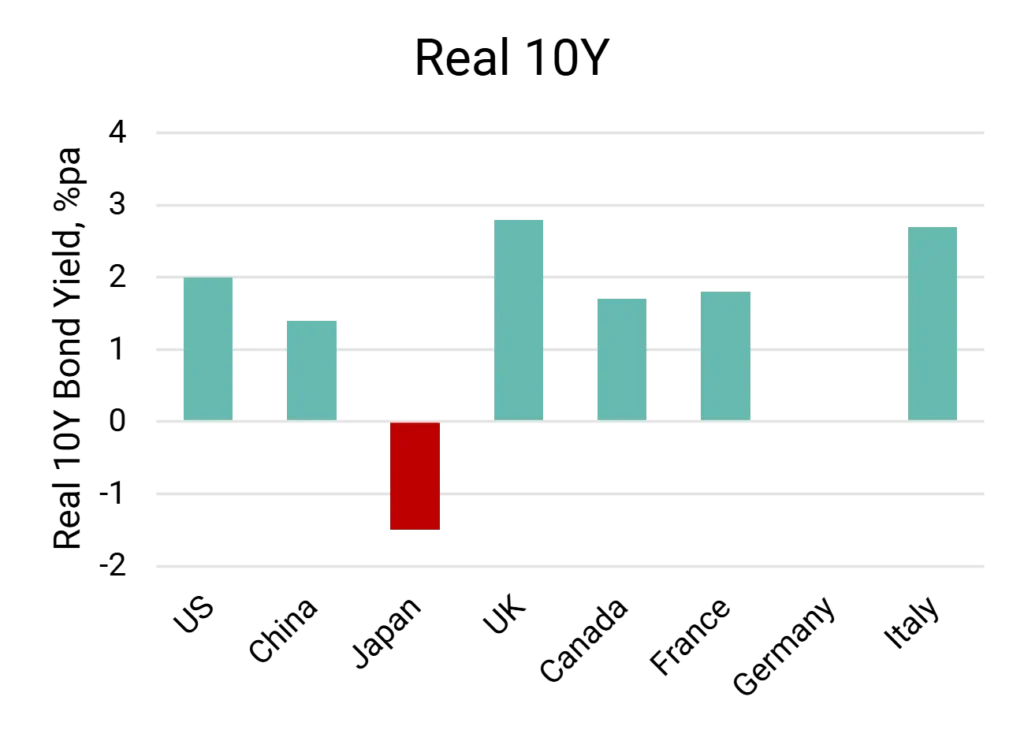
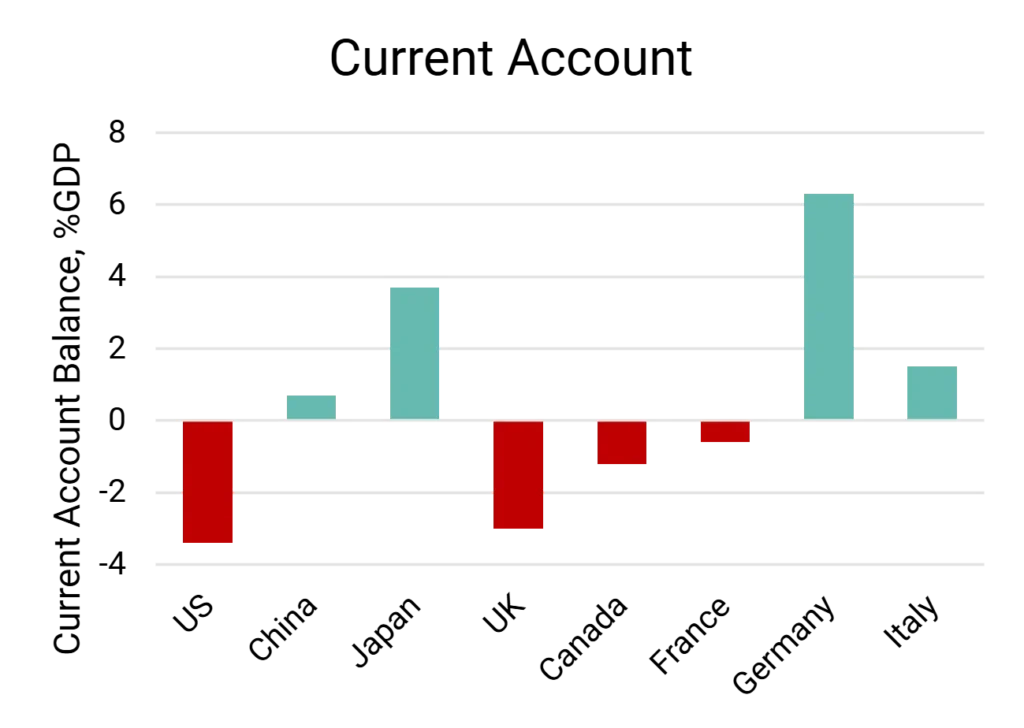
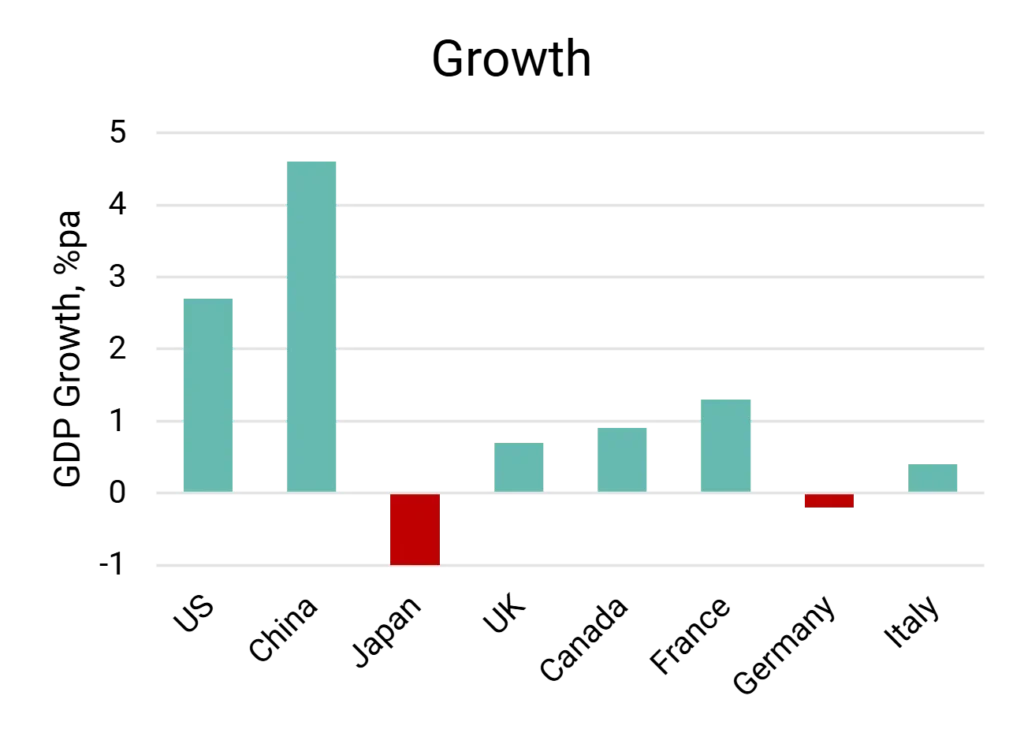
Technology-driven industry re-alignments, trade disruption and regulatory shifts are clouding the 2025 default outlook for G7 and Chinese economies. Countries seeking to avoid US import tariffs face stark trade alliance choices, while political pressure to reduce US short rates could stoke inflation. The US fiscal challenge is to balance lower tax revenues vs efficiency savings while absorbing the impact of cutbacks and deportations. Some sectors will gain, others will lose; but tariffs, tax cuts and loose monetary policy, should bring a short-term boost to the economy, keeping corporate and financial default rates low vs other G7 economies. The charts below show current key G7 + China economic indicators.
Source: The Economist
The US economy remains strong and long-term real rates are moderate, but a growing current account deficit strengthens the case for protectionism. Tax cuts will boost growth, but lower US short rates and higher import tariffs are inflationary despite lower oil prices. Tariffs will hit all major US trading partners, but UK and Japan are more vulnerable than EU economies.
Japan and Germany face high inflation, shrinking Current Account surpluses if tariffs hit exports and growth rates, and both have a growing defence burden.
Italy has a current account surplus, thanks to strong Asian demand for luxury goods plus low dependence on Russian gas. It also runs a primary fiscal surplus, although its historic Sovereign debt load keeps real borrowing rates high. France has similar long term real rates as the US and a mid-range current account deficit, but sluggish growth and political paralysis. The UK’s weak current account and LDI crisis hangover have left it with high real rates but some scope for monetary easing; partly offsetting its vulnerability to trade shocks.
China’s strong but below-trend growth rate follows the domestic real estate bust, despite various fiscal stimulus packages. As the world’s largest oil importer, it will benefit from lower oil prices but faces exceptionally high US tariffs in 2025 – negative for China’s traditional role as global credit supplier, positive for various other countries. Nomura lists the main winners from Chinese trade diversion as Vietnam, Chile, Malaysia, Argentina, Hong Kong, Mexico, Korea, Singapore, Brazil and Canada – so Canada may gain here as well as lose from tariffs.
Major shifts in trade and regulation and shifts in the technological and corporate landscape will have some impact on default rates. But even extreme events can have a surprisingly mixed effect on overall default rates. See appendix for chart showing the 40-year track record for loan delinquency rates across US Commercial Banks.
Scott Bessent as Treasury Secretary may shift policy emphasis to tax cuts and financial de-regulation. During Trump’s last term in office the US economy grew by 2.7%; tax cuts helped, although they also boosted the deficit – and Citadel economists expect another round of tax cuts to increase the deficit back to Covid levels. The IMF expect global growth to dip by 0.8%. The CEBR expect the UK to lose about 0.2% pa due to US trade policy, and UBS predict 0.5% off growth in China.
2025 G7 + China Default Risk Forecast
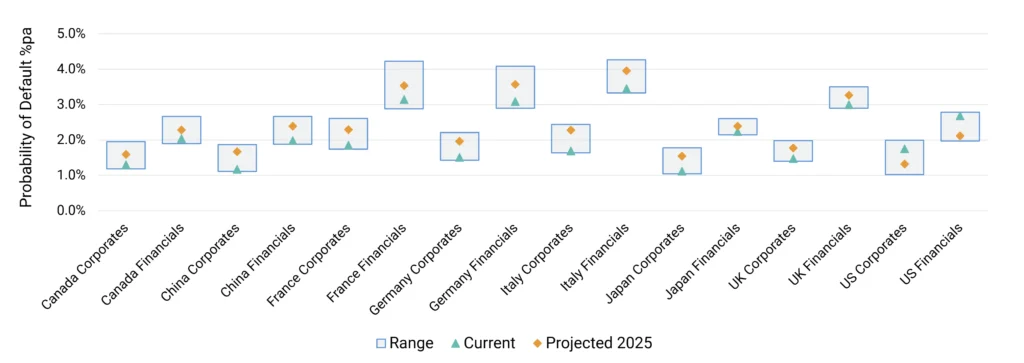
Credit Benchmark’s 2025 Projected Changes in 1-year Default^ Rates – G7 + China
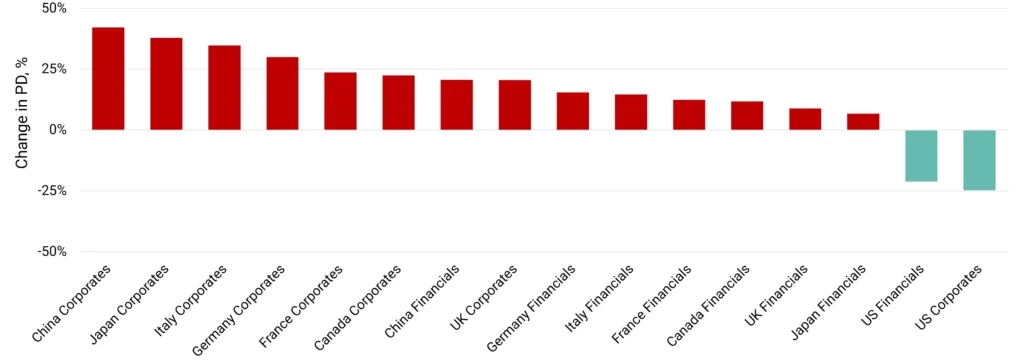
Credit Benchmark’s 2025 Default Risk Projections and Ranges for High Yield Indices – G7 + China
Key Takeaways
- US Financials and Corporates* expected to improve in 2025.
- China and Japan Corporates could see material deterioration from low base.
- Corporates default rate projected increases larger than Financials for most countries, reflecting recent higher migration rates towards downgrades.
- US credit migration rates for past 12 months already favour improvement
- UK ranges narrower, reflecting historic low PD volatility; this could increase in 2025.
- Most Financials ranges wider than Corporates equivalent, due to historic volatility.
* Covering all corporate sectors in Credit Benchmark’s Industry Schema but excluding financial institutions.
^ Default Risk is defined as an average of the index constituents’ Probability of Default (PD), projected one year forward. See Methodology section for more detail.
Outlook for US Corporates* & Financials
Tax cuts, rate cuts and financial deregulation bring lower default^ rates – but tariff and inflation impact mixed.
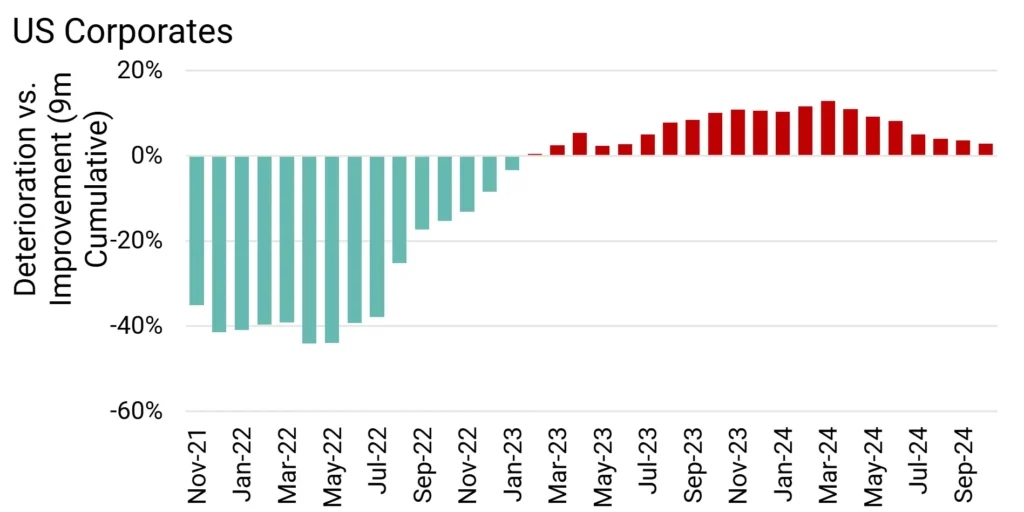
All US Corporates Credit Deteriorations vs Credit Improvements 9m Rolling
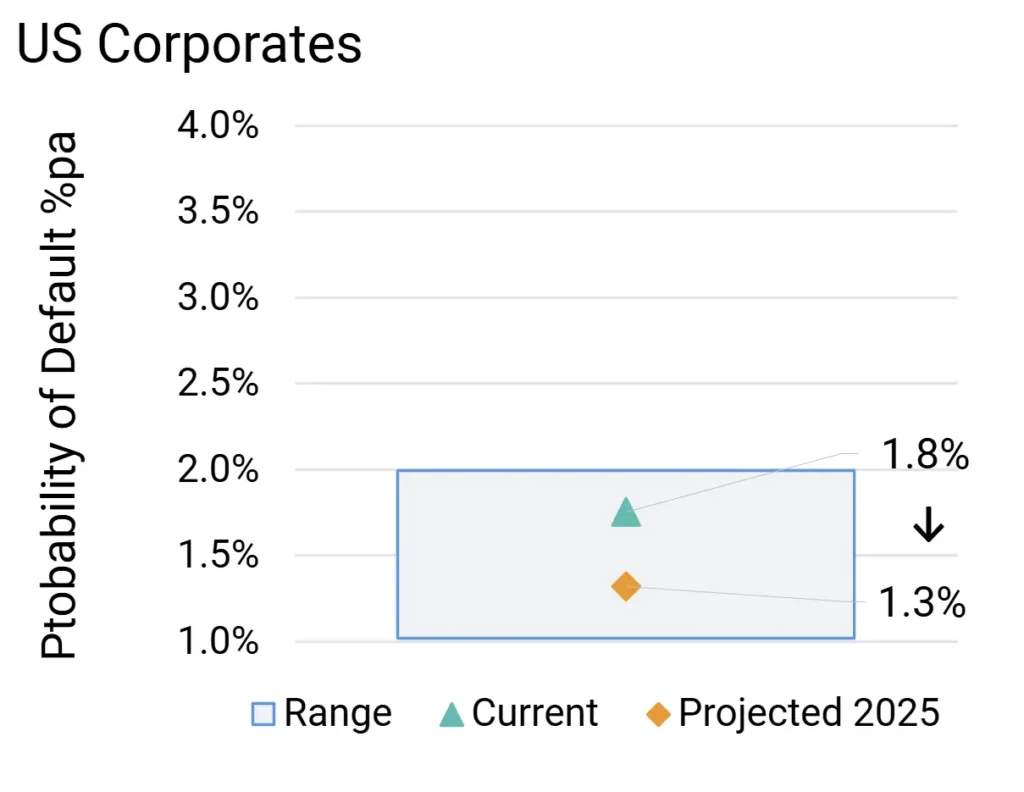
US High Yield Corporates Probability of Default Projections
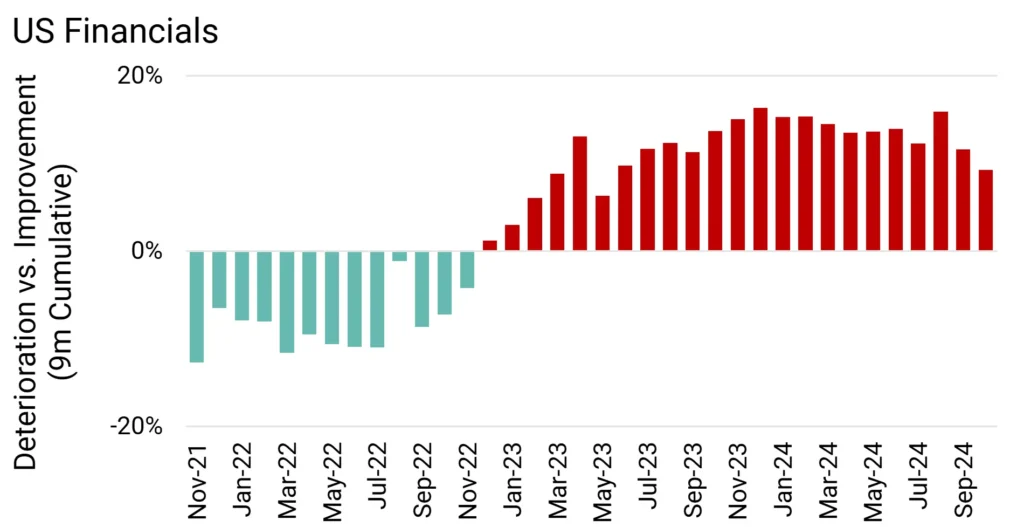
All US Financials Credit Deteriorations vs Credit Improvements 9m Rolling
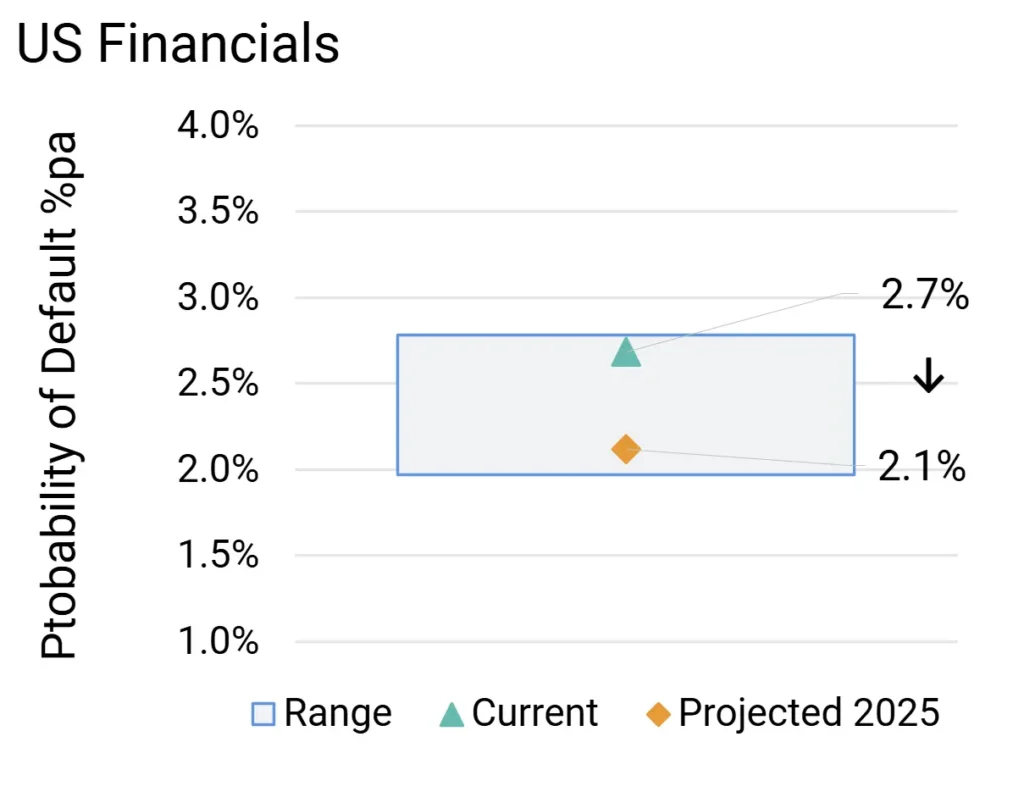
US High Yield Financials Probability of Default Projections
Key Takeaways
- High Yield Probability of Default; Now & Projected Q4 25:
-
- Corporates 1.3% from 1.8%
- Financials 2.1% from 2.7%
- US Corporate credit deteriorations and credit improvements in balance; credit deteriorations moderately outweigh credit improvements in US Financials. Expect both to move to net credit improvement as regulations eased, monetary policy loosened and tax cuts take effect.
- Proportion of borrowers in “c”-category is main default rate driver – America first policy may hurt some smaller or weaker companies e.g. importers, but many local SMEs could benefit.
* Covering all corporate sectors in Credit Benchmark’s Industry Schema but excluding financial institutions.
^ Default Risk is defined as an average of the index constituents’ Probability of Default (PD), projected one year forward. See Methodology section for more detail.
Outlook for Canada Corporates* & Financials
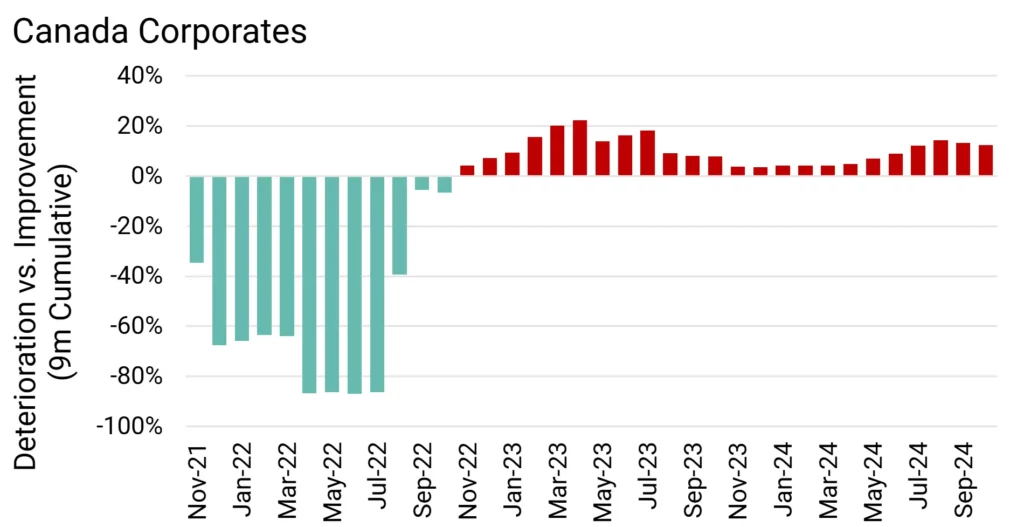
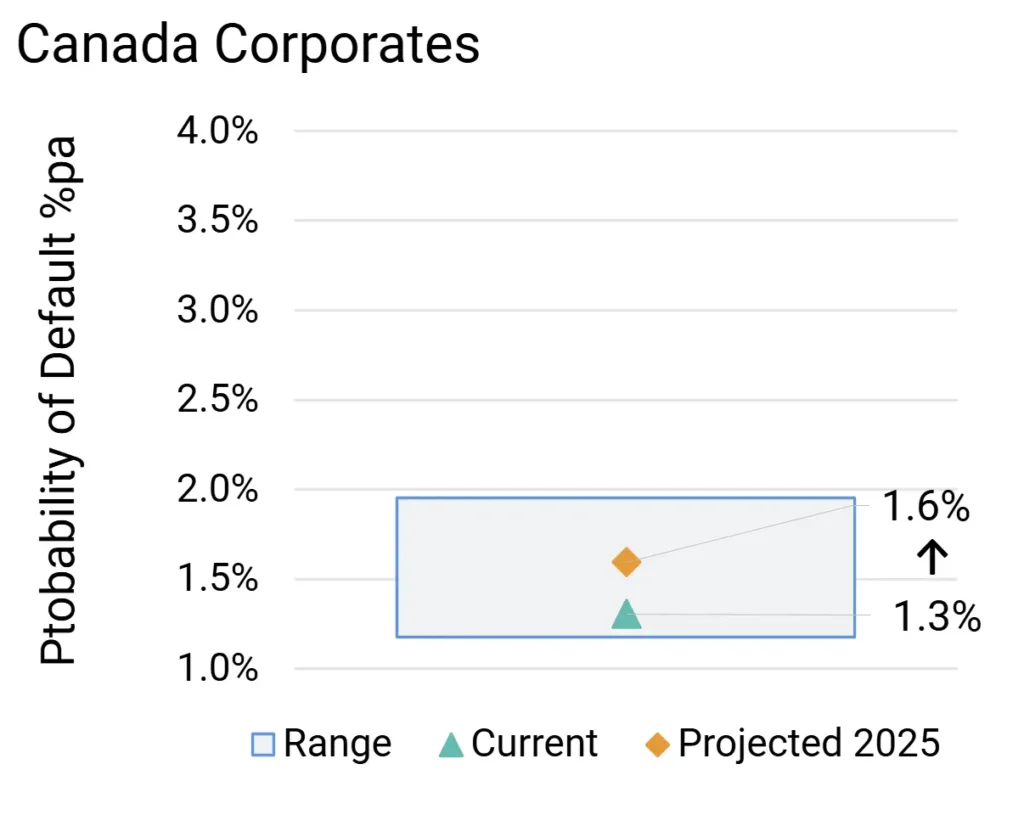
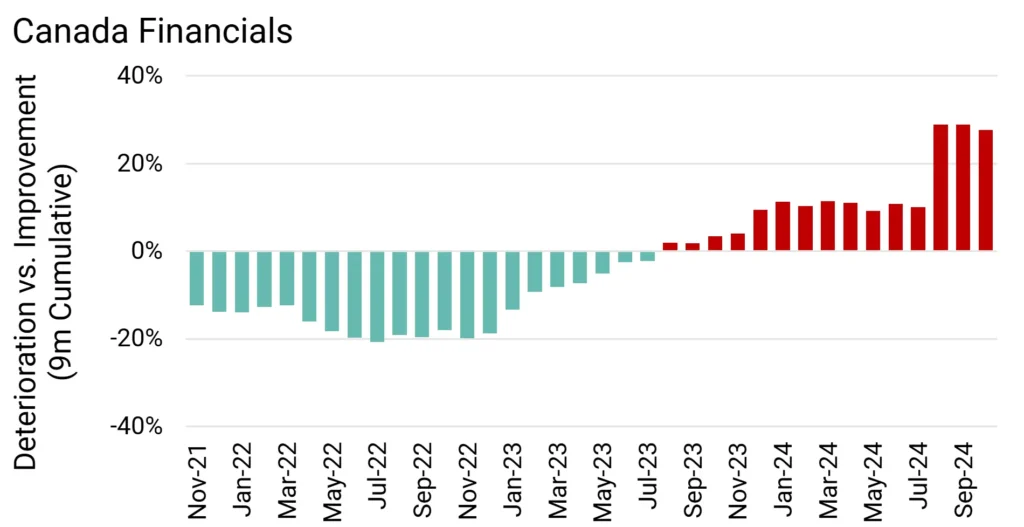
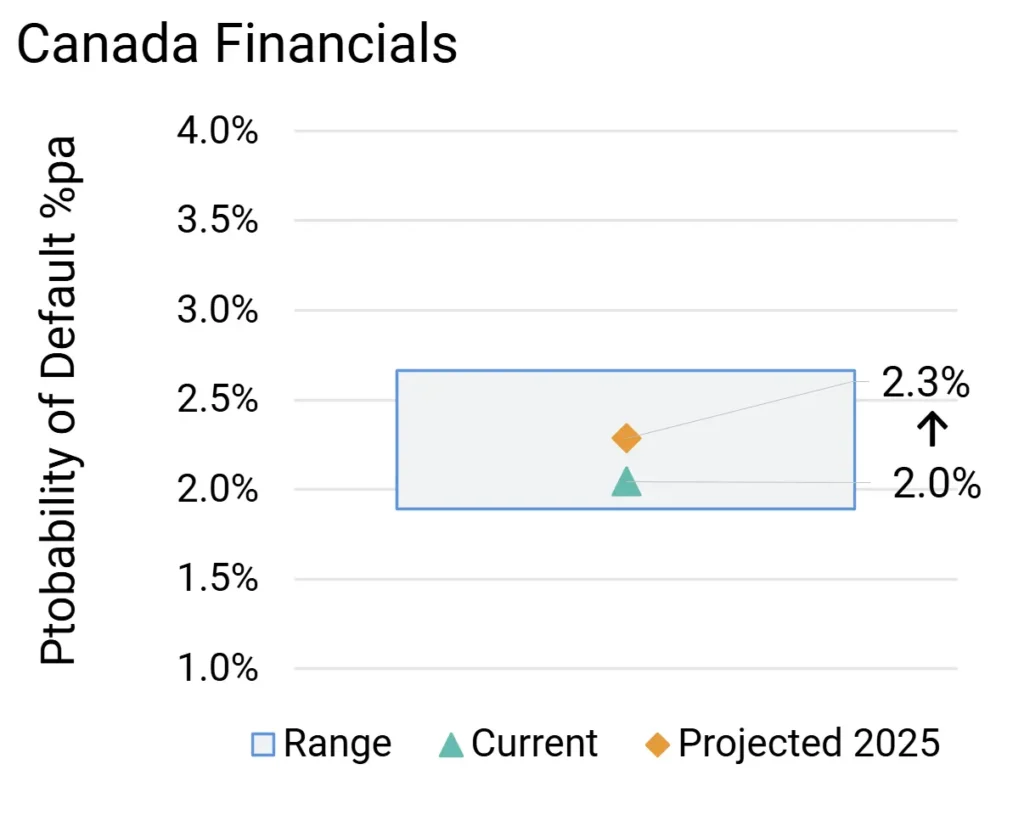
Modest increase in default^ rates. Tariff impact likely to be limited; domestic politics is the main driver.
All Canada Corporates Credit Deteriorations vs Credit Improvements 9m Rolling
Canada High Yield Corporates Probability of Default Projections
All Canada Financials Credit Deteriorations vs Credit Improvements 9m Rolling
Canada High Yield Financials Probability of Default Projections
Key Takeaways
- High Yield Probability of Default; Now & Projected Q4 25:
-
- Corporates 1.6% from 1.3%
- Financials 2.3% from 2.0%
- Credit deteriorations slightly outweigh credit improvements. Canada Financials expected to stabilise after recent spike in revisions, but modest trend of credit deterioration in Canada Corporates likely to continue if tariffs bite.
- Major tariff target, but overall impact on economy limited due to global commodity exposure. Domestic politics dominates.
* Covering all corporate sectors in Credit Benchmark’s Industry Schema but excluding financial institutions.
^ Default Risk is defined as an average of the index constituents’ Probability of Default (PD), projected one year forward. See Methodology section for more detail.
Outlook for Germany Corporates* & Financials
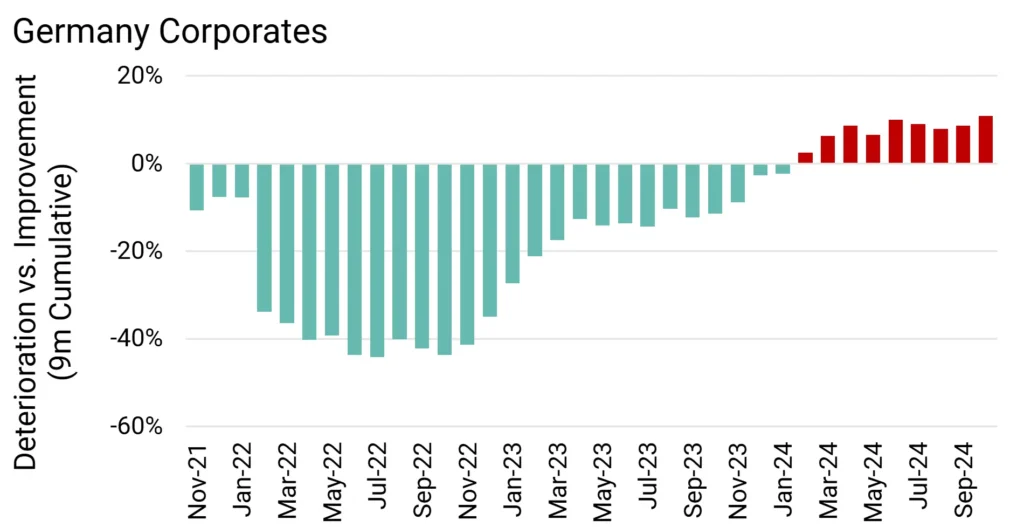
Default^ rates to rise on weak growth and growing defence burden; tariff hit above EU average, especially in Autos.
All Germany Corporates Credit Deteriorations vs Credit Improvements 9m Rolling
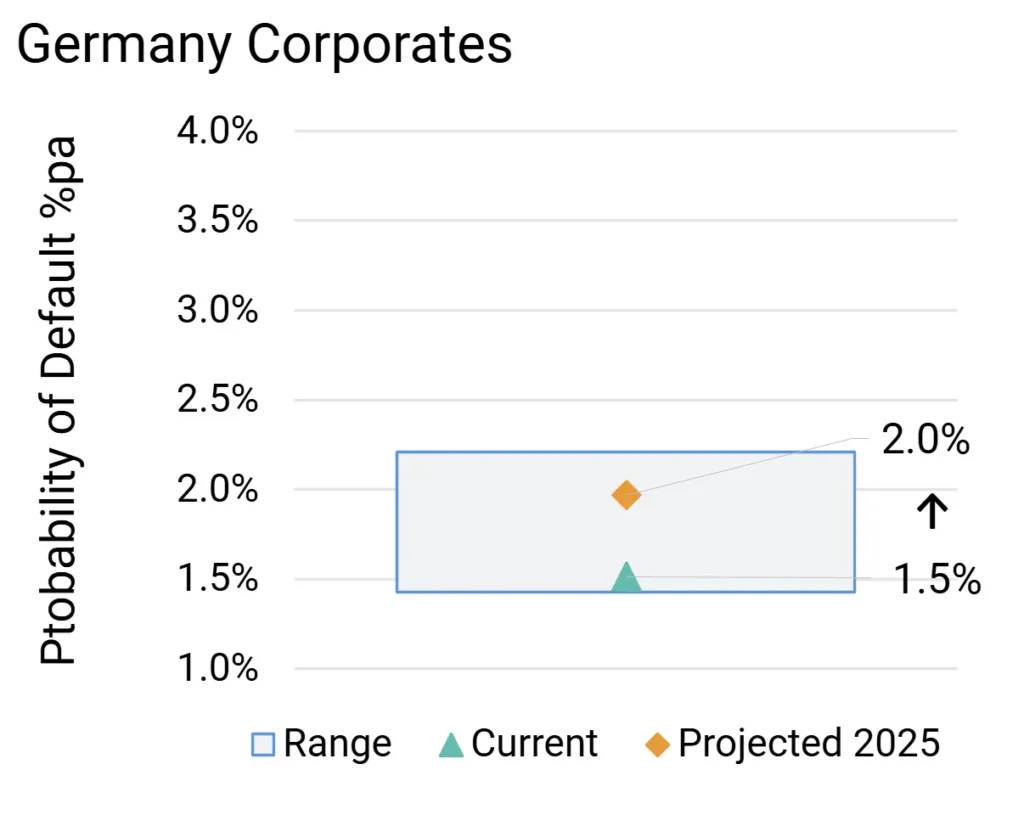
Germany High Yield Corporates Probability of Default Projections
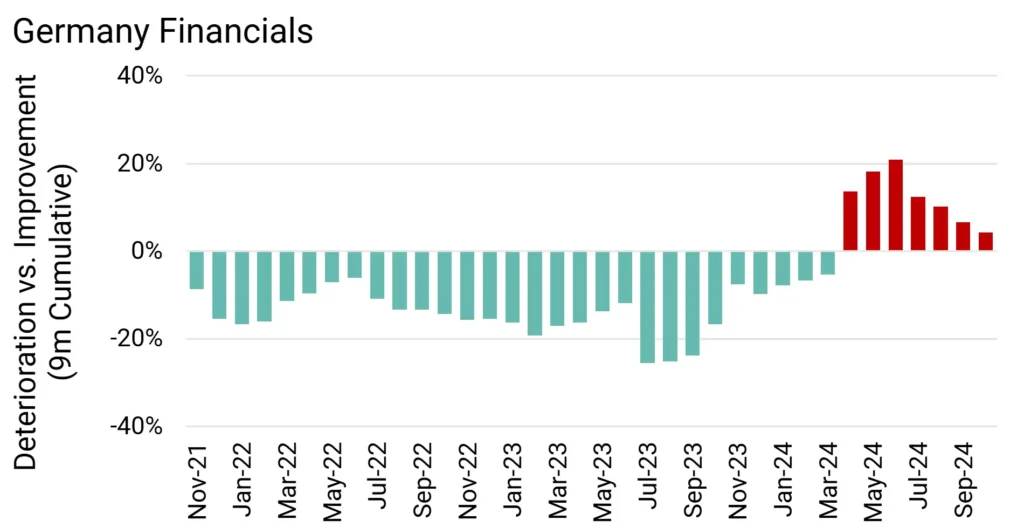
All Germany Financials Credit Deteriorations vs Credit Improvements 9m Rolling
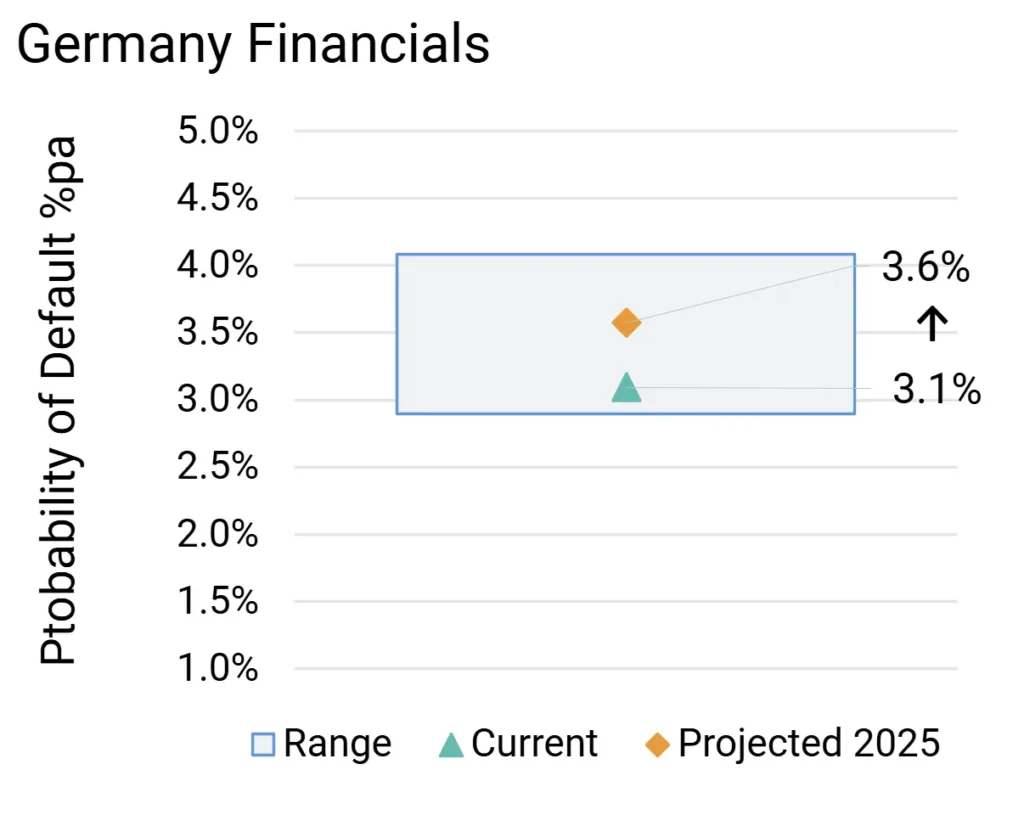
Germany High Yield Financials Probability of Default Projections
Key Takeaways
- High Yield Probability of Default; Now & Projected Q4 25:
-
- Corporates 2.0% from 1.5%
- Financials 3.6% from 3.1%
- Credit deteriorations slightly outweigh credit improvements. Germany Financials could move to net credit improvement soon but credit deterioration likely to continue in Germany Corporates.
- Tariffs will hit German trade surplus with US, and increasing NATO burden will strain fiscal position. US deregulation likely negative for Financials.
* Covering all corporate sectors in Credit Benchmark’s Industry Schema but excluding financial institutions.
^ Default Risk is defined as an average of the index constituents’ Probability of Default (PD), projected one year forward. See Methodology section for more detail.
Outlook for France Corporates* & Financials
Modest increase in default^ rates; domestic strains and rising bond yields add to limited US policy impacts.
All France Corporates Credit Deteriorations vs Credit Improvements 9m Rolling
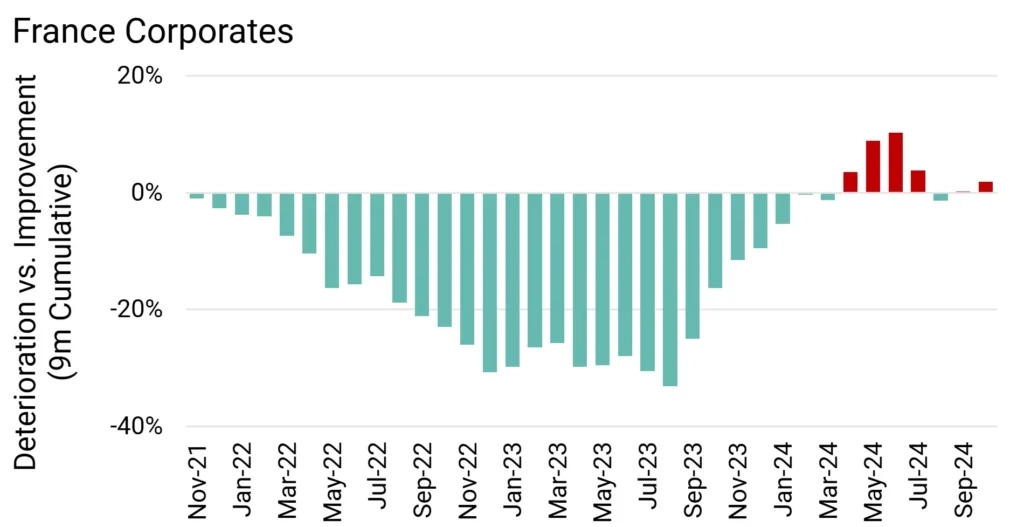
France High Yield Corporates Probability of Default Projections
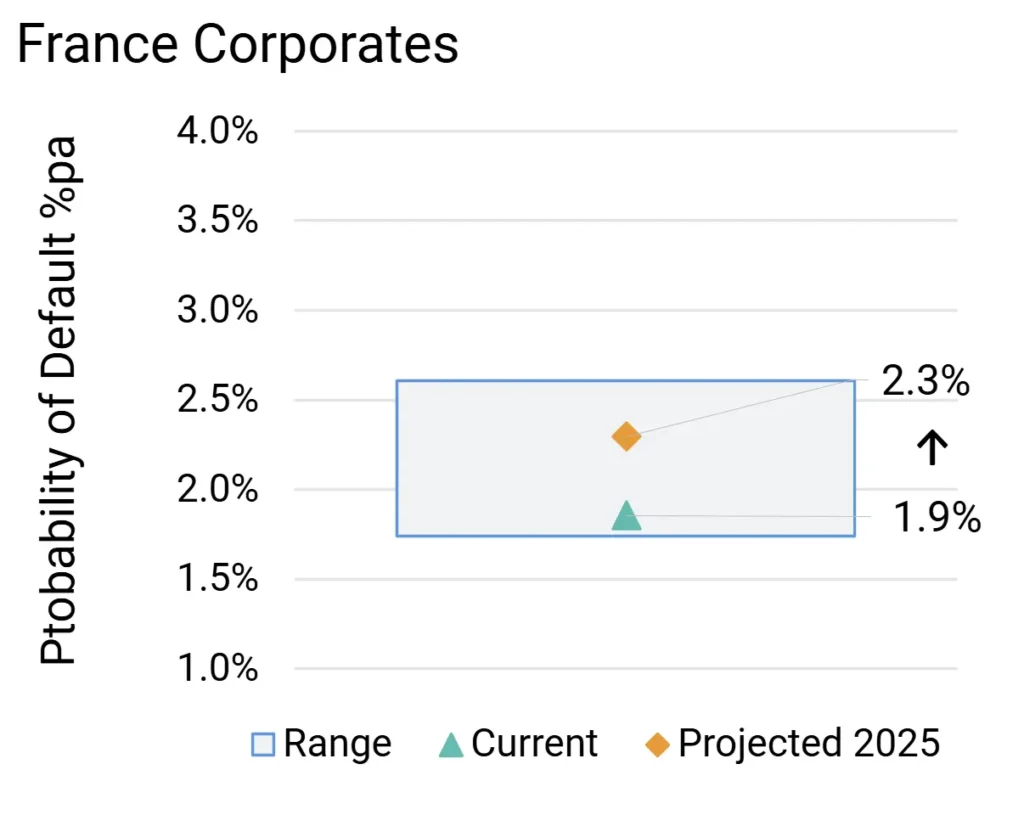
All France Financials Credit Deteriorations vs Credit Improvements 9m Rolling
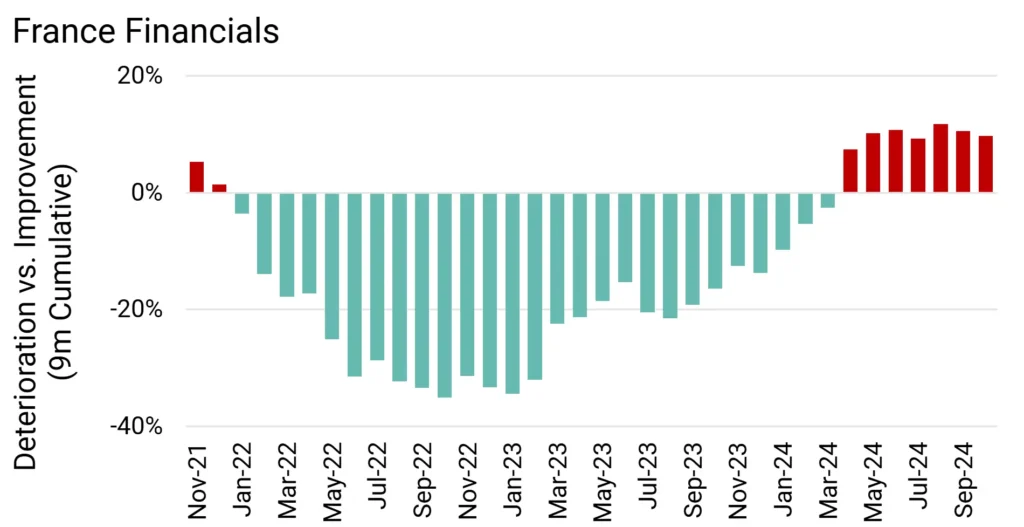
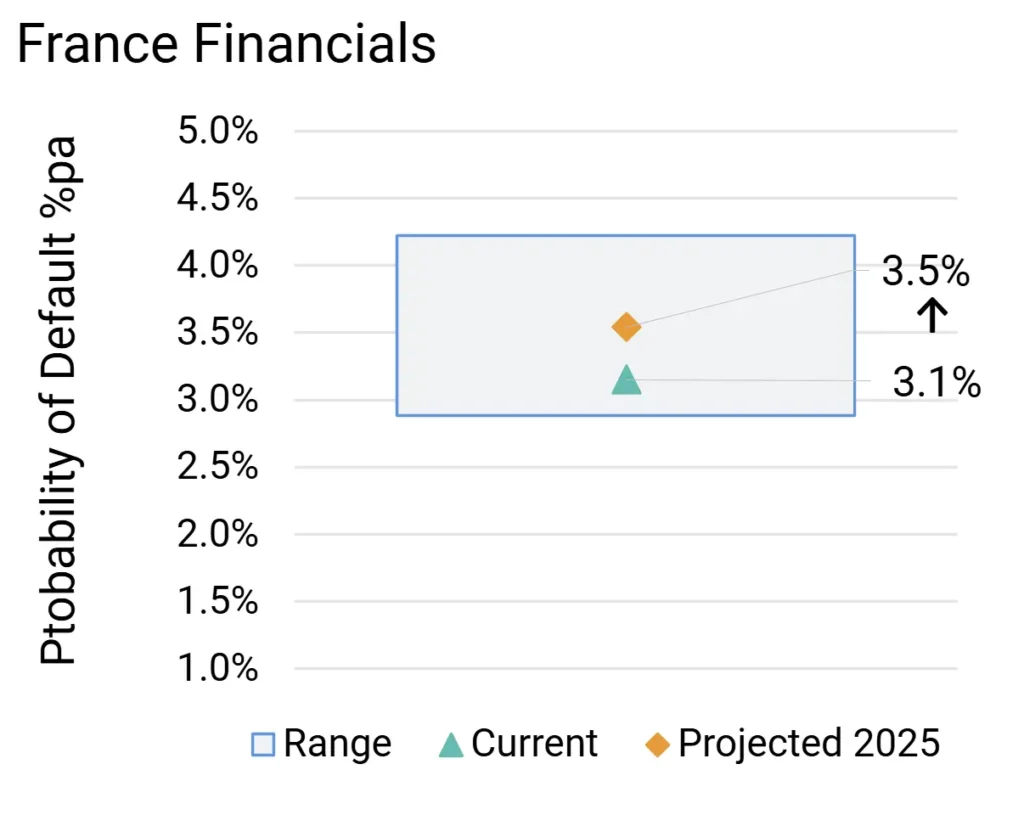
France High Yield Financials Probability of Default Projections
Key Takeaways
- High Yield Probability of Default; Now & Projected Q4 25:
-
- Corporates 2.3% from 1.9%
- Financials 3.5% from 3.1%
- France Corporates: Credit deteriorations and credit improvements balanced but further gains unlikely in current domestic and international context.
- France Financials: Credit deteriorations outweigh credit improvements, likely to persist if bond yields continue rising.
- US policy impact negative for trade; less immediate impact from US financial deregulation.
* Covering all corporate sectors in Credit Benchmark’s Industry Schema but excluding financial institutions.
^ Default Risk is defined as an average of the index constituents’ Probability of Default (PD), projected one year forward. See Methodology section for more detail.
Outlook for Italy Corporates* & Financials
Corporate default^ rates to rise as domestic credit cycle unfolds; Financials less vulnerable; limited US policy impact.
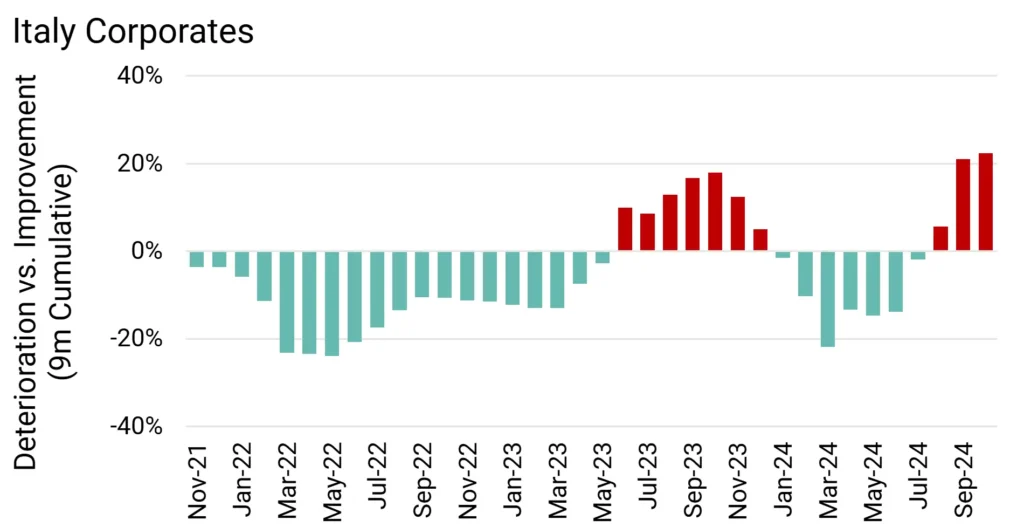
All Italy Corporates Credit Deteriorations vs Credit Improvements 9m Rolling
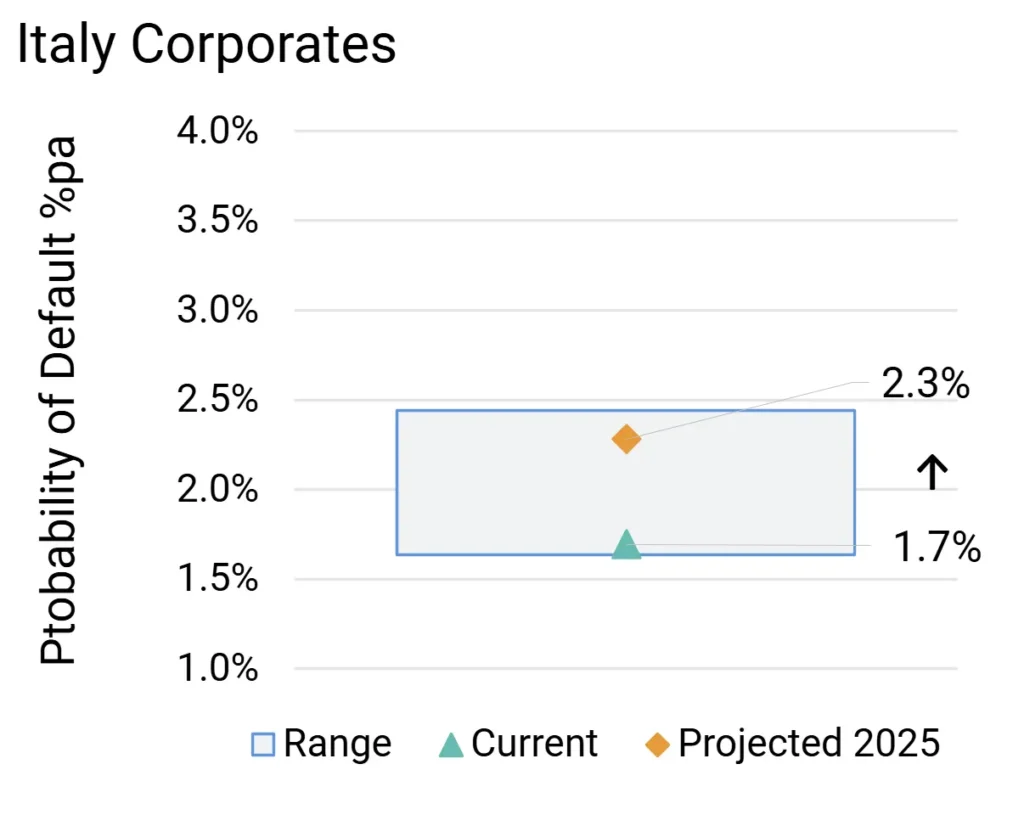
Italy High Yield Corporates Probability of Default Projections
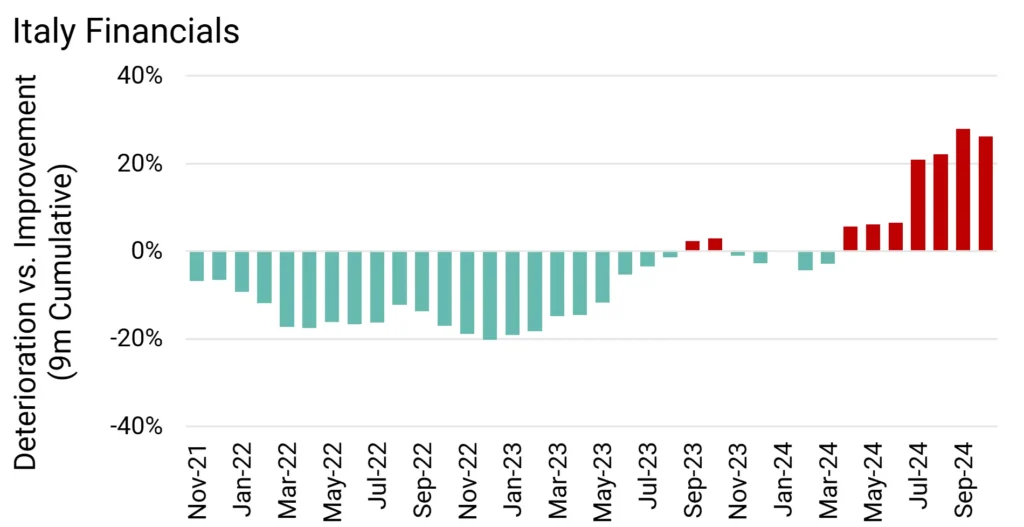
All Italy Financials Credit Deteriorations vs Credit Improvements 9m Rolling
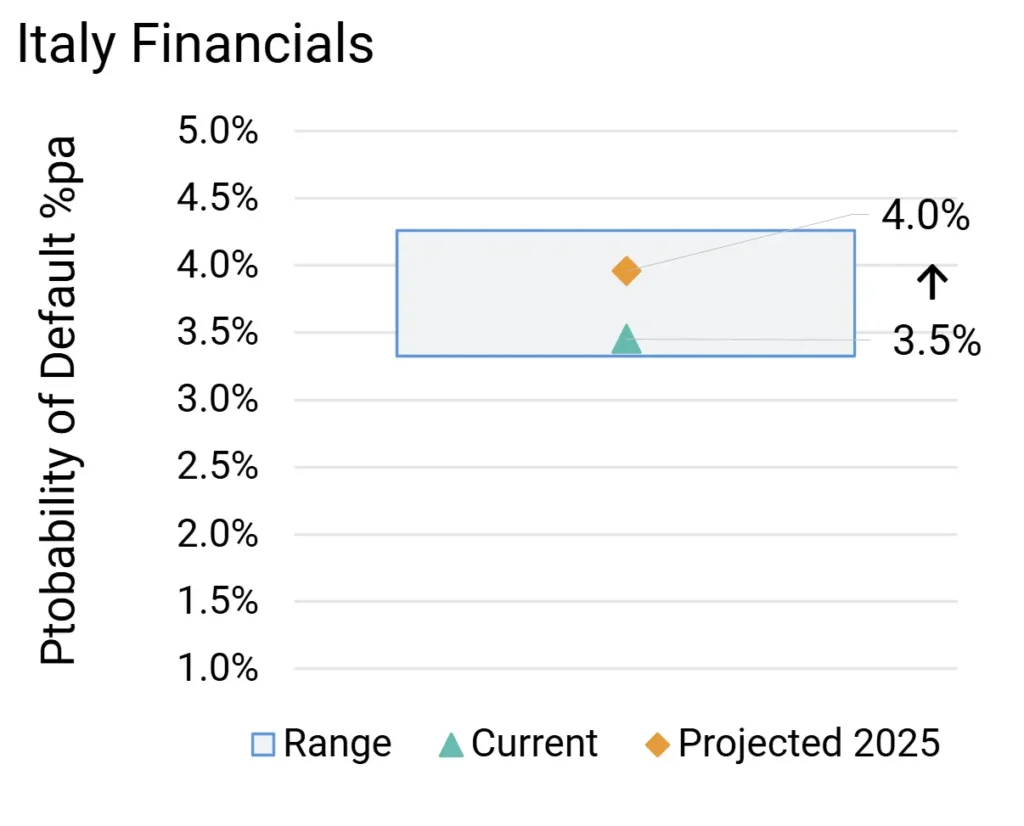
Italy High Yield Financials Probability of Default Projections
Key Takeaways
- High Yield Probability of Default; Now & Projected Q4 25:
-
- Corporates 2.3% from 1.7%
- Financials 4.0% from 3.5%
- Credit deteriorations outweigh credit improvements with Italy Corporates in early stage of deterioration phase.
- US policy impact: limited. Weak growth, but trade is mainly with EU and Asia. Italian domestic banks dominate finance so US deregulation impact unlikely.
* Covering all corporate sectors in Credit Benchmark’s Industry Schema but excluding financial institutions.
^ Default Risk is defined as an average of the index constituents’ Probability of Default (PD), projected one year forward. See Methodology section for more detail.
Outlook for UK Corporates* & Financials
Increasing default^ rates due to trade isolation, weak growth and fiscal drag. Corporates more exposed than Financials.
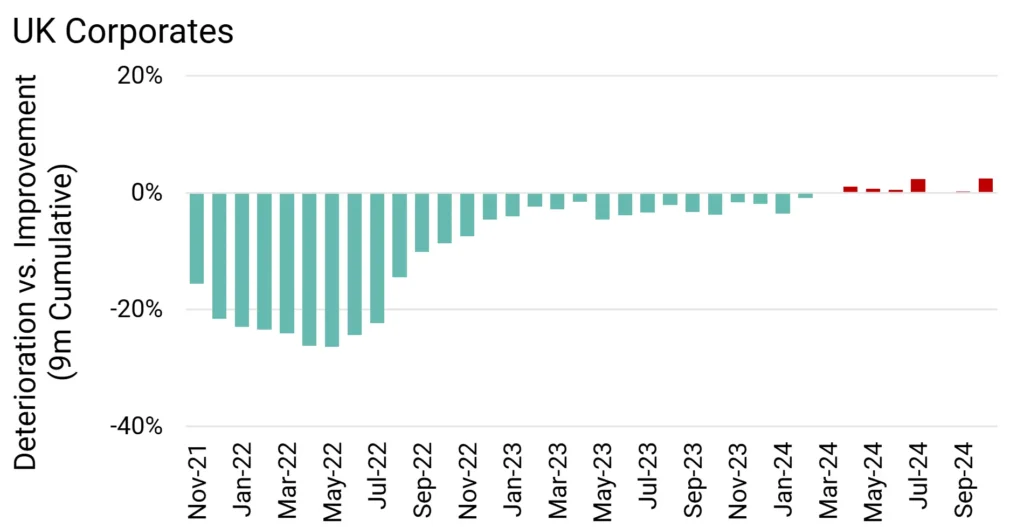
All UK Corporates Credit Deteriorations vs Credit Improvements 9m Rolling
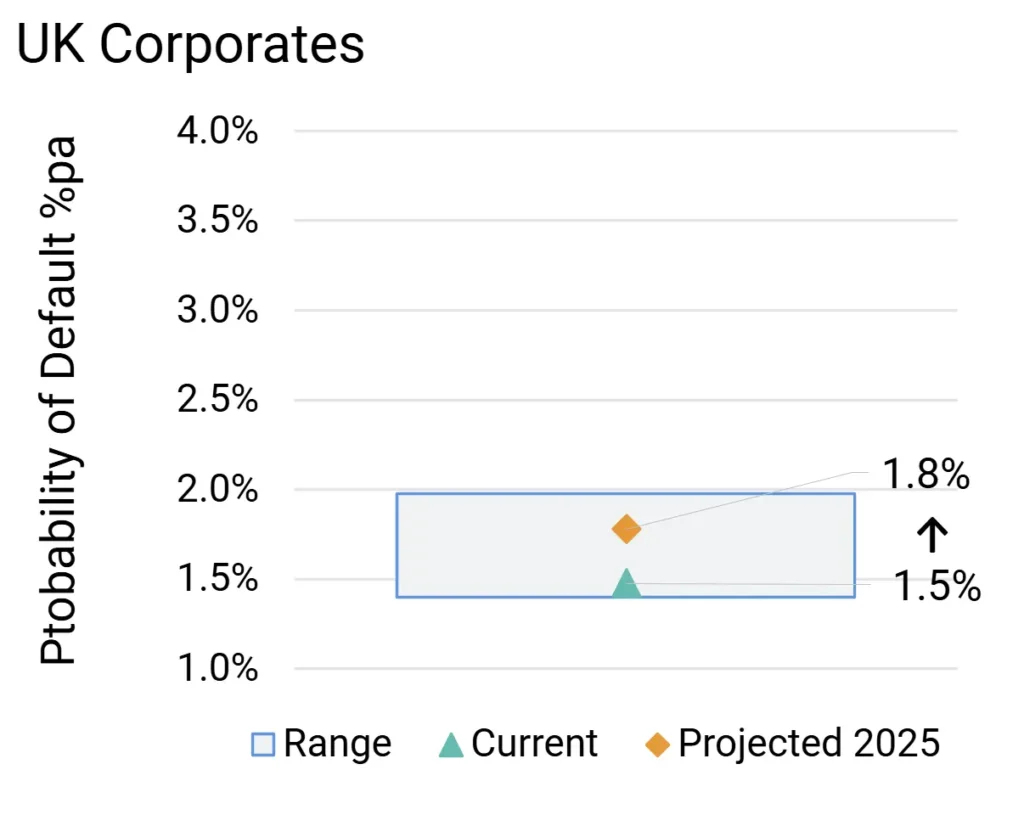
UK High Yield Corporates Probability of Default Projections
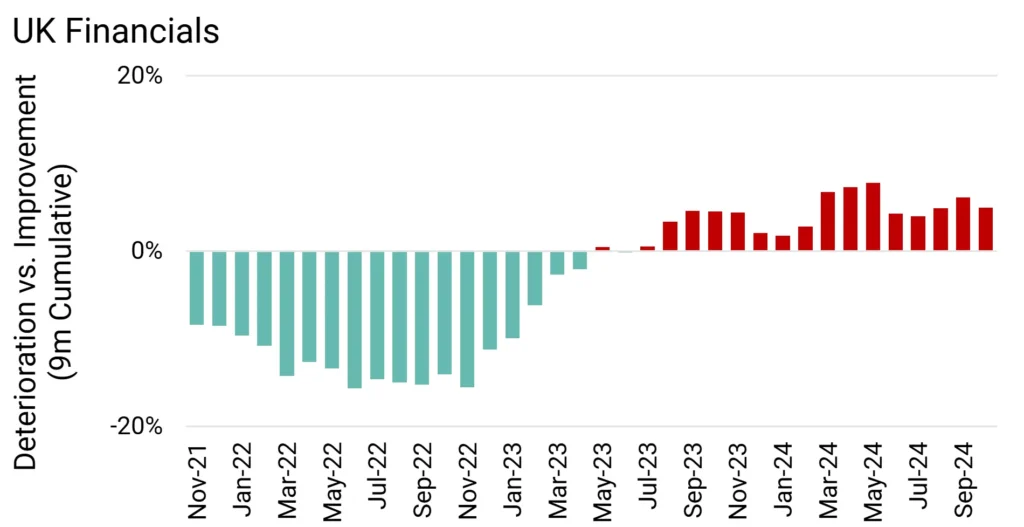
All UK Financials Credit Deteriorations vs Credit Improvements 9m Rolling
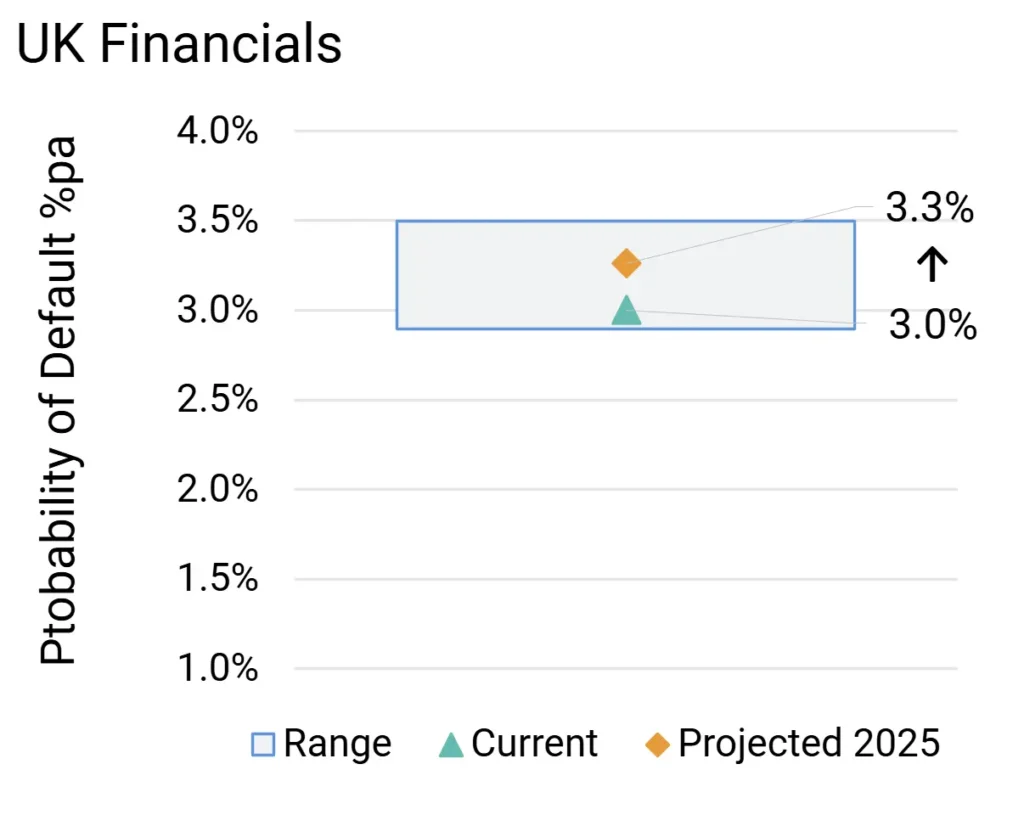
UK High Yield Financials Probability of Default Projections
Key Takeaways
- High Yield Probability of Default; Now & Projected Q4 25:
-
- Corporates 1.8% from 1.5%
- Financials 3.3% from 3.0%
- Credit deteriorations outweigh credit improvements in UK Financials; UK Corporates balanced. Credit deterioration in 2025 possible for both.
- US policy impact likely to be higher for UK Corporates due to trade exposures. UK Financials could see modest benefit from US deregulation.
* Covering all corporate sectors in Credit Benchmark’s Industry Schema but excluding financial institutions.
^ Default Risk is defined as an average of the index constituents’ Probability of Default (PD), projected one year forward. See Methodology section for more detail.
Outlook for Japan Corporates* & Financials
Rising default^ rates due to weak growth, tariffs and rising defence burden. Corporate outlook more negative than Financial.
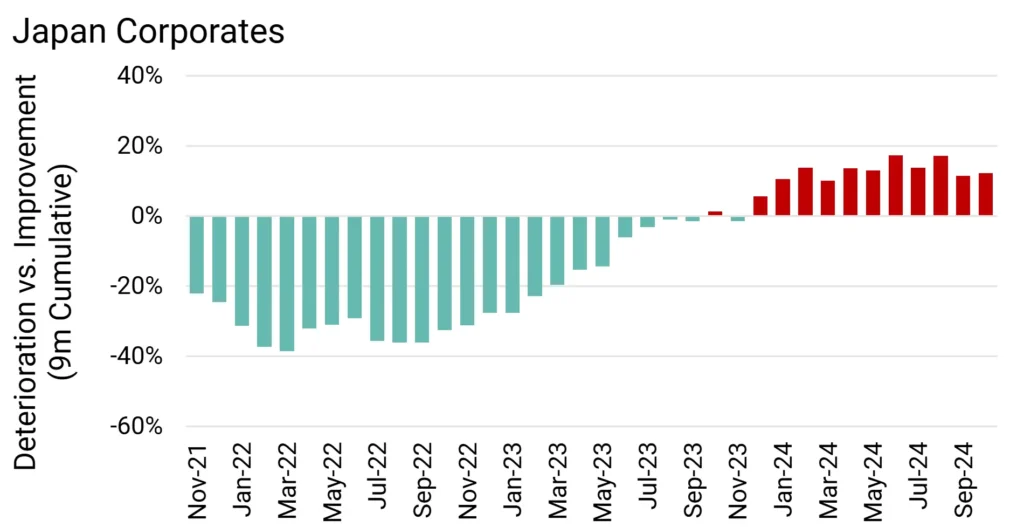
All Japan Corporates Credit Deteriorations vs Credit Improvements 9m Rolling
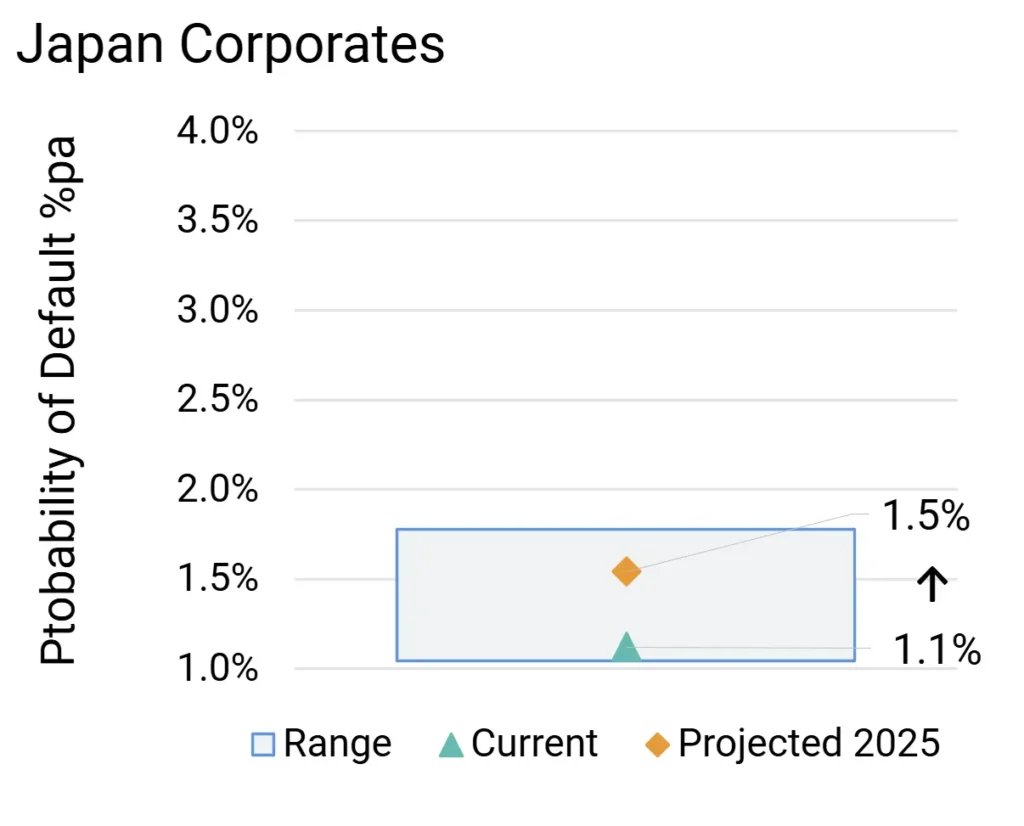
Japan High Yield Corporates Probability of Default Projections
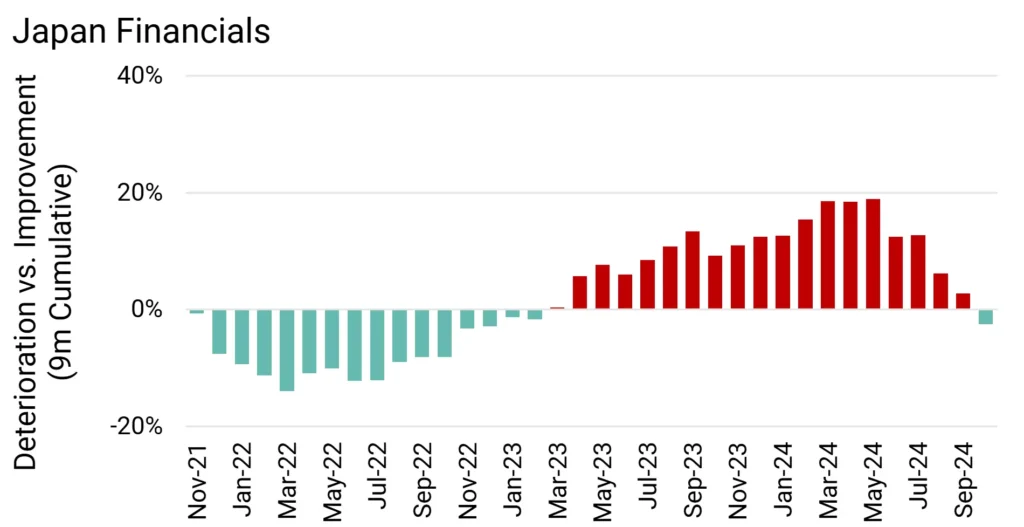
All Japan Financials Credit Deteriorations vs Credit Improvements 9m Rolling
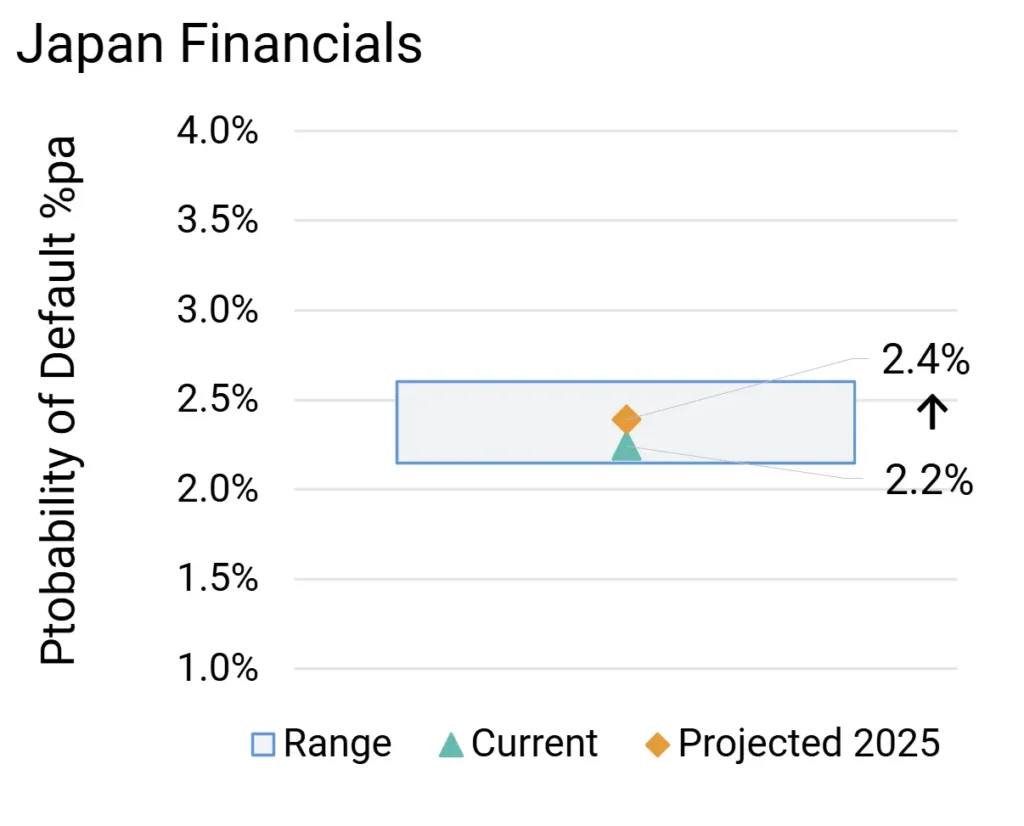
Japan High Yield Financials Probability of Default Projections
Key Takeaways
- High Yield Probability of Default; Now & Projected Q4 25:
-
- Corporates 1.5% from 1.1%
- Financials 2.4% from 2.2%
- Credit deteriorations outweigh credit improvements in Japan Corporates; expected to continue.
- Japan Financials have rapidly moved into balance. Any increase in default rates should be small.
- US policy impact likely to be higher for Japan Corporates due to trade exposures. Japan Financials could see modest benefit from US deregulation.
* Covering all corporate sectors in Credit Benchmark’s Industry Schema but excluding financial institutions.
^ Default Risk is defined as an average of the index constituents’ Probability of Default (PD), projected one year forward. See Methodology section for more detail.
Outlook for China Corporates* & Financials
Higher default^ rates due to tariff hikes; Corporates more vulnerable than Financials on 12-month view.
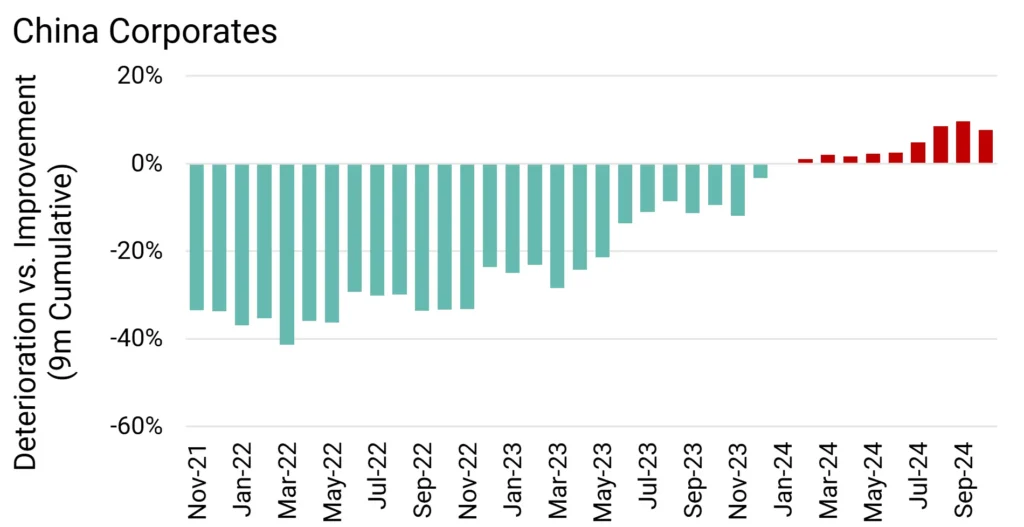
All China Corporates Credit Deteriorations vs Credit Improvements 9m Rolling
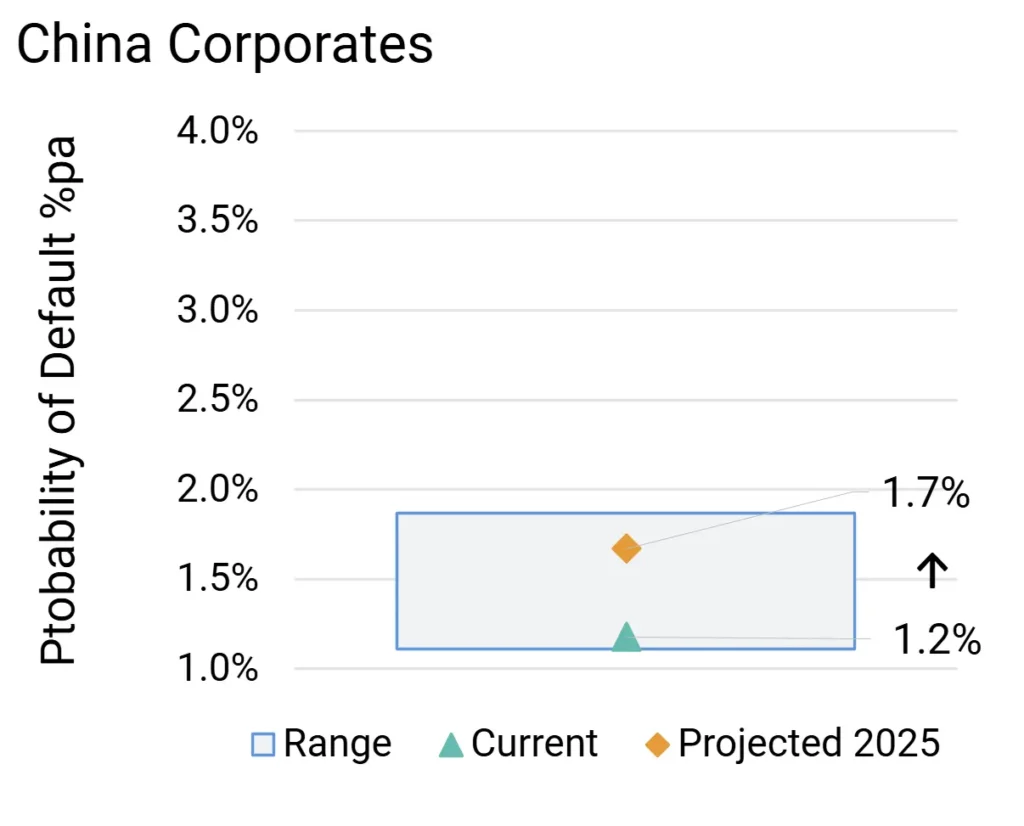
China High Yield Corporates Probability of Default Projections
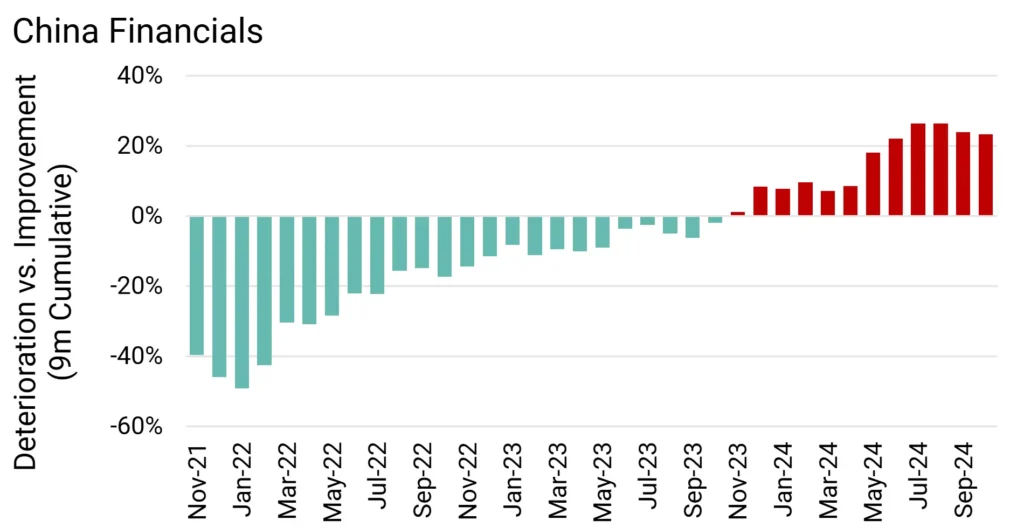
All China Financials Credit Deteriorations vs Credit Improvements 9m Rolling
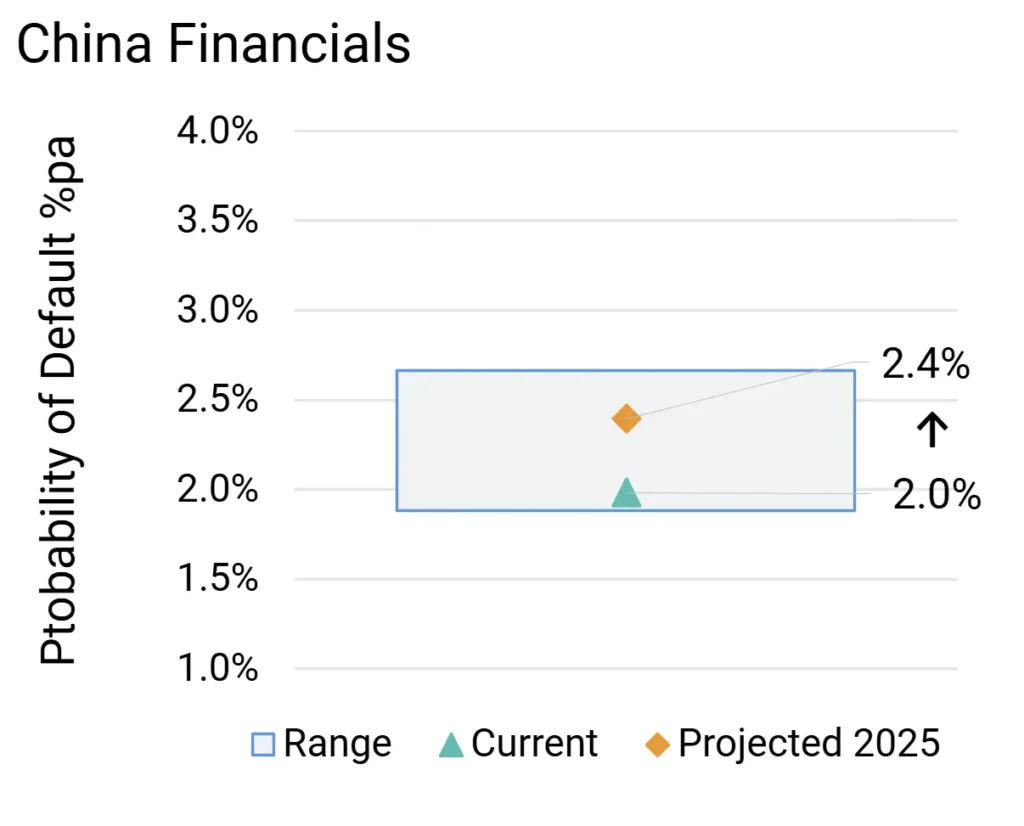
China High Yield Financials Probability of Default Projections
Key Takeaways
- High Yield Probability of Default; Now & Projected Q4 25:
-
- Corporates 1.7% from 1.2%
- Financials 2.4% from 2.0%
- Credit migrations for the past year already biased to downgrades.
- Credit deteriorations outweigh credit improvements, especially in China Financials; China Corporates moderately negative. Further credit deterioration likely for both, although China Financial credit cycle could turn positive in H2 2025.
- US tariffs negative for trade (despite “tariff proofing” by some Chinese Corporates in recent years) – this will hamper attempts to stimulate the economy. As major holder of US Treasuries, higher US long rates could hit the China Financial sector.
* Covering all corporate sectors in Credit Benchmark’s Industry Schema but excluding financial institutions.
^ Default Risk is defined as an average of the index constituents’ Probability of Default (PD), projected one year forward. See Methodology section for more detail.
Appendix
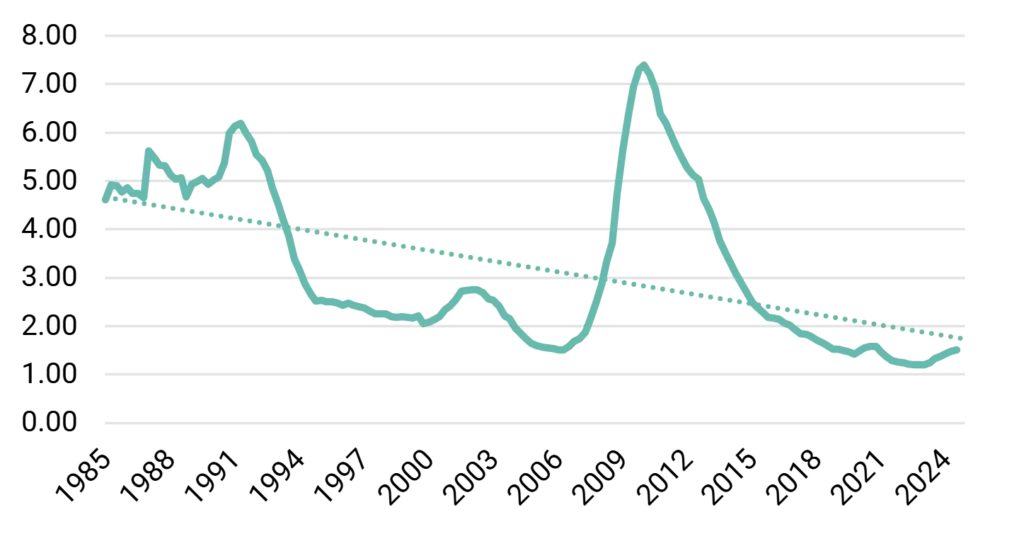
Delinquency Rates on US Commercial Bank Loans
This chart shows the 40-year track record for loan delinquency rates across US Commercial Banks
Source: St Louis Federal Reserve FRED
The fitted trend decline shows a post-1987 crash peak, a Dotcom bubble burst blip, and a huge subprime bust spike – but Covid and Ukraine barely register. Excluding the subprime era, delinquency rates volatility is about 5% per quarter, 10% pa. So, a current rate of 2% has a normal range of 1.8% to 2.2% over the following year.
Proposed tariffs of 20%+ echo the notorious 1930 Smoot-Hawley Act that collapsed global trade flows – but the 2024 global economy looks far more resilient. Even the largest recent shock – Post-Lehman financial crisis in 2008 – cut GDP by only 10%, with a sharp recovery the following year.
The FRED data shows a loose relationship between GDP growth and Delinquency rates, depending on sample period: very roughly, a 100 Bps drop in GDP growth adds about 3% to the delinquency rate. This can be used to draw up some possible 2025 scenarios.
Methodology
Additional definitions and explanations
-
- Projections are based on derived metrics from 1-Year ex ante Probability of Default (“PD”) estimates contributed by major global banks.
- Projected default rates are a combination of:
-
Current credit profile projected one year forward using relevant Type (Corporate vs. Financials) and Country 1-year transition matrix
-
Current 6-month DIN trend projected 12 months ahead – projected proportionate change is applied to PD, adjusted by % of index constituents in “b” and “c” credit categories.
-
“Republican Administration Adjustments”: Most negative for China, most positive for US, non-US G7 economies between these two boundaries.
-
- Ranges are based on long term annualised volatility of PD monthly changes
-
-
- For US, lower bound of range is 2sd below lower of current and projected PD.
- For non-US, upper bound of range is 2sd above higher of current and projected PD.
-
About this report
Credit Benchmark’s Default Risk Outlook draws on an extensive database of 110,000+ unique Credit Consensus Ratings (CCRs). These CCRs represent the internal risk views of expert analysts at the world’s leading banks – a previously untapped source of risk intelligence. 90% of the entities with CCRs are not rated by a major credit rating agency, meaning these projections offer a new and significant capacity for analysing default risk.
Although this report focuses on G7 Corporates and Financials, the methodology can be applied to the broad and highly representative dataset of 110,000+ CCRs (see our Research Library for US, UK and EU Default Forecasts by Industry). The default projections can be customized for our clients to match their own classification schemas and align more accurately with their portfolios and exposures.
Vigilant risk management is vital when navigating an unpredictable economic climate. With broader, deeper, and more frequent analytics than previously available, Credit Benchmark is now able to offer the market a comprehensive and differentiated view on default risks.
If you would like a free and fully confidential analysis of the default risk projections of your own portfolio, we encourage you to get in touch here.

