Global Corporates, Financials and Sovereigns All Net Downgrades
Key Findings:
- Global Corporates vs. Global Financials vs. Global Sovereigns: All Net Downgrades, Modest Risk Rise Likely Soon
- Industry and Sector Turning Points: Funds, Real Estate and Electricity Turning Positive; EU and Oil & Gas Negative
- US Sector PD Comparisons: US Fixed Line Telecomms Is Largest Monthly Drop
- Credit Volatility: Various Percentiles Continue to Drop, Along With the Equity VIX
- Leveraged Loans: Global, US and UK Corporates Deteriorating, UK and Now Global Financials Improving
- Sovereign PD vs. Ratio of Financial to Corporate PD: Financial Sector Strength Relies on Government Credit
- US Regional Banks: Prolonged Deterioration Setting In?
- US Retail: US General Retailers Credit and Equity Is Down
Introduction
The world economy is still grappling with inflation and rising interest rates, partly driven by public sector pandemic debts. Private personal debt has also ballooned during the easy money era, fostering a large, unregulated shadow banking industry. While some corporates have emerged from the QE period with strong balance sheets, others have growing debts as consumer spending has dropped and existing supply chains have shifted or weakened. Mainstream banks expect to see delinquency rates rise, although these are likely to be concentrated in the consumer and SME sectors.
The US debt ceiling is an arbitrary boundary, but the recent near-default is a symptom of the dilemma facing the global economy: how to attract savings to fund desperately needed investment in infrastructure, re-engineered supply chains and climate-friendly technology, while keeping the consumer-led economy functioning to provide a tax base. Current inflation is not just a reaction to the Ukraine war; it reflects the end of globalisation, debt and supply chain disruption due to Covid, and the increasing impact of climate change on food production, transport and lifestyles. “Higher for longer” interest rates may become a permanent fixture.
But despite the pre-hike warnings of doom, many economies have shrugged off higher rates. It is clear that consumers have adjusted by rationing luxuries, house prices have stalled, SME defaults are rising, and corporate earnings have had some disappointments, but the predicted deep recession has not materialised. The IMF has just upgraded UK growth forecasts. By contrast, growth is lacklustre in France and especially Germany; but inflation there is also dropping; giving some hope that inflation can be tamed.
Perhaps the real pain of mortgage resets and AI-driven layoffs has yet to bite, but there is surprising buoyancy in some sectors. From a credit perspective, some areas that have seen the largest deteriorations are now turning positive.
This month’s outlook covers the regular topics of industry and sector trends and turning points. It also updates the US Regional Bank index and features reports on US Consumer subsectors as well as the relationship between Sovereign risk and the Financial / Corporate risk ratio.
Global Corporates vs. Global Financials vs. Global Sovereigns
All Net Downgrades, Modest Risk Rise Likely Soon
The following charts show global trends for average Probability of Default (PDs) and their 2-year Credit Consensus Indicators (CCIs)1.
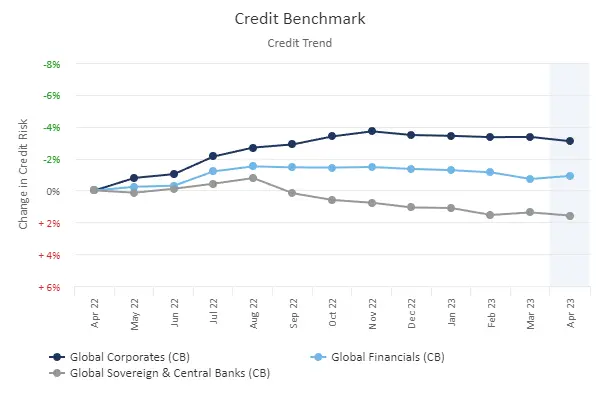
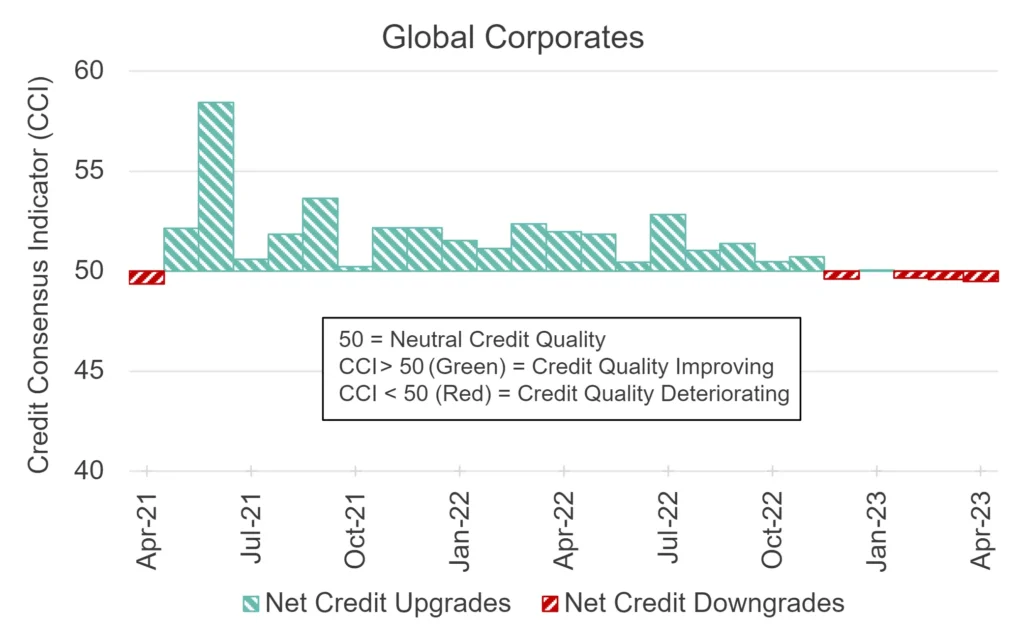
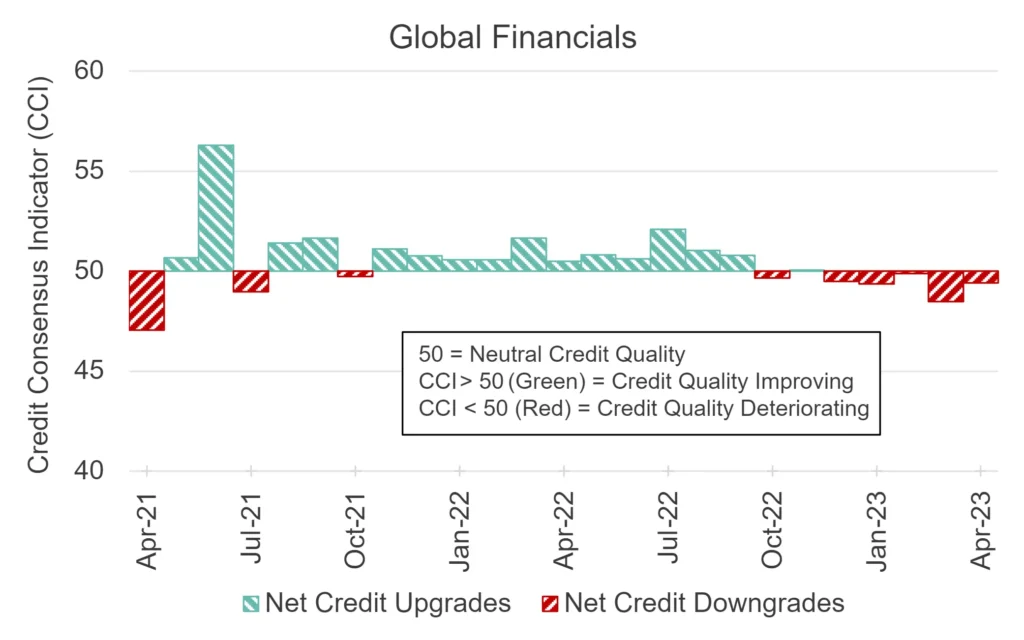
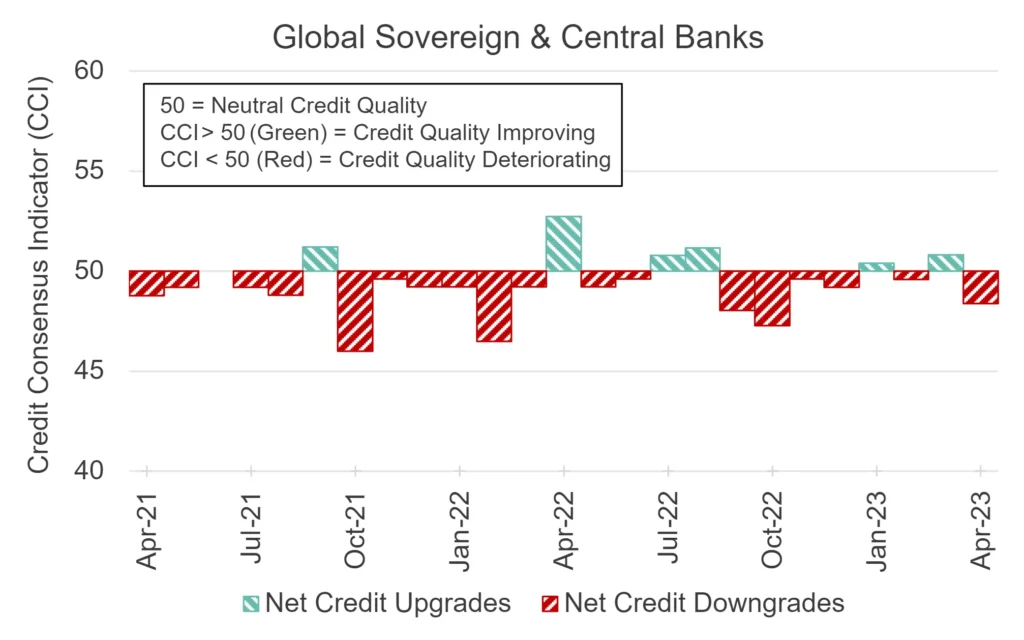
Globally, Sovereign PDs return to deterioration. Corporates continue to deteriorate whilst Financials show an uptick. But downgrades slightly outnumber upgrades for all three, suggesting that modest PD increases could be on the horizon.
Industry and Sector Turning Points
Funds, Real Estate and Electricity Turning Positive; EU and Oil & Gas Negative
The lists below shows detailed global industries and sectors that may be at turning points. These have either started to show negative balances after a run of positives, or vice versa.
| Positive Turning Point: |
| Previous 3M Negative, Current 1M Improving |
| 1. Africa Utilities |
| 2. Canada Mutual Fund |
| 3. EU Investment Services |
| 4. Europe Conventional Electricity |
| 5. Europe Electricity |
| 6. Europe Real Estate Holding & Development |
| 7. Europe Real Estate Holding & Development |
| 8. Europe Specialty Chemicals |
| 9. Global Food Producers |
| 10. Global Private Equity Fund |
| 11. Global Real Estate Investment & Services |
| 12. Global Real Estate Services |
| 13. Global Software |
| 14. Ireland Technology |
| 15. Italy Mutual Fund |
| 16. Luxembourg Consumer Goods |
| 17. Luxembourg Corporates |
| 18. Mexico Consumer Goods |
| 19. North America Food Producers |
| 20. North America Food Products |
| 21. North America Heavy Construction |
| 22. North America Hedge Fund |
| 23. North America Mutual Fund |
| 24. North America Specialty Retailers |
| 25. South Africa Industrial Transportation |
| 26. South Africa Transportation Services |
| 27. UK Conventional Electricity |
| 28. UK Electricity |
| 29. UK Financials |
| 30. UK Large Utilities |
| 31. UK Pension Fund |
| 32. UK Real Estate Holding & Development |
| 33. UK Real Estate Investment & Services |
| 34. UK Utilities |
| 35. US Heavy Construction |
| 36. US Hedge Fund |
| 37. US Mutual Fund |
| Negative Turning Point: |
| Previous 3M Improving, Current 1M Negative |
| 1. Africa Consumer Services |
| 2. Africa General Retailers |
| 3. Africa Nonferrous Metals |
| 4. EU Gas, Water & Multi-utilities |
| 5. EU Large Industrials |
| 6. EU Large Utilities |
| 7. EU Media |
| 8. EU Multi-utilities |
| 9. EU Utilities |
| 10. Europe Beverages |
| 11. Europe Consumer Services |
| 12. Europe Distillers & Vintners |
| 13. Europe Distillers & Vintners |
| 14. Global Oil & Gas |
| 15. Middle East Corporates |
| 16. Netherlands Oil & Gas Producers |
| 17. North America Commercial Vehicles & Trucks |
| 18. North America Recreational Services |
| 19. South Africa Consumer Services |
| 20. UK Consumer Services |
| 21. UK Large Consumer Goods |
| 22. UK Large Consumer Services |
| 23. UK Specialty Retailers |
| 24. UK Transportation Services |
| 25. US Oil & Gas |
| 26. US Oil Equipment, Services & Distribution |
| 27. US Recreational Services |
| 28. Spain Utilities |
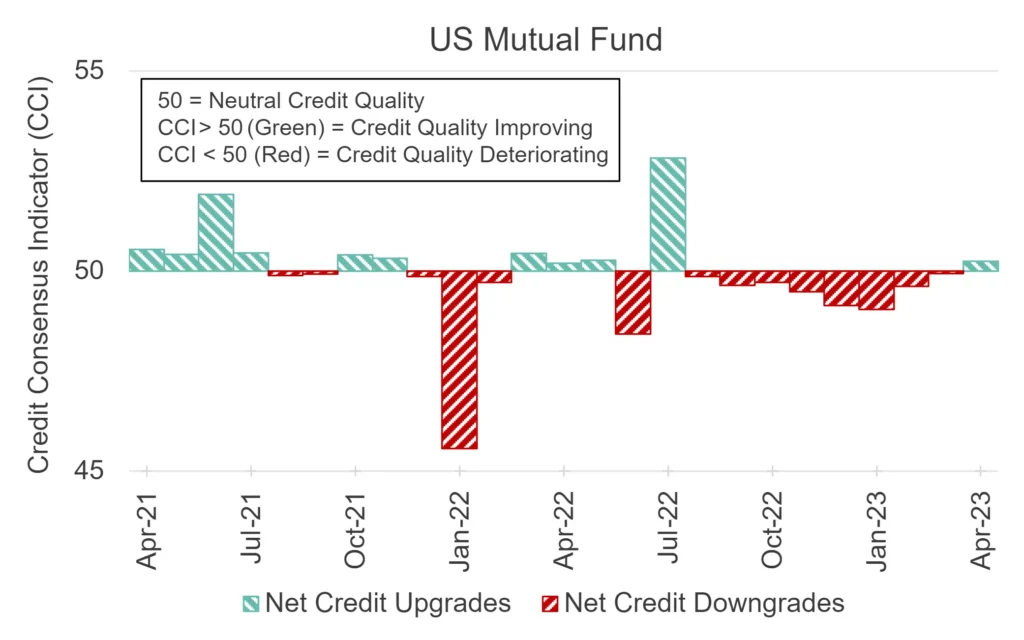
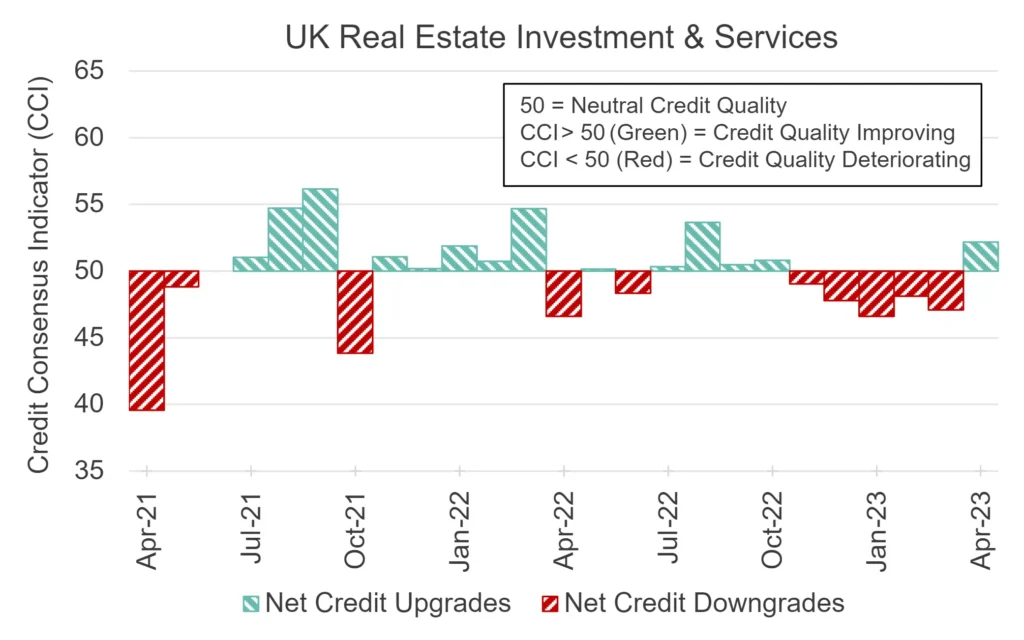
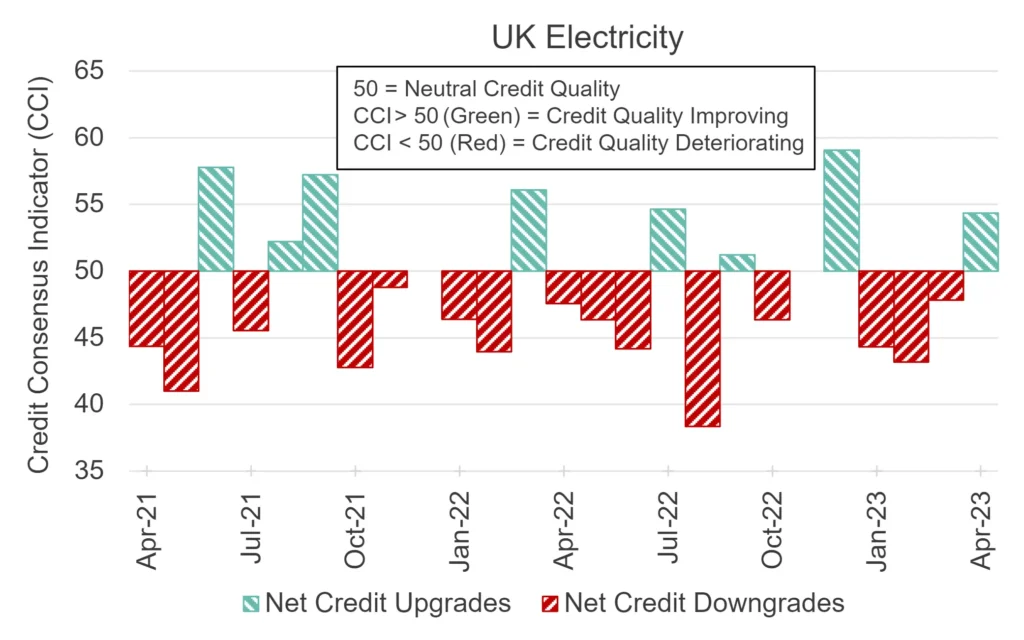
These trend shifts are spread across diverse sectors. Funds feature heavily in the positive turning point column (left), in particular Mutual and Hedge Funds across US, Canada and Globally. Global, Europe and UK Real Estate also appear in the positive turning point column. UK and Europe Electricity return to positive credit outlook.
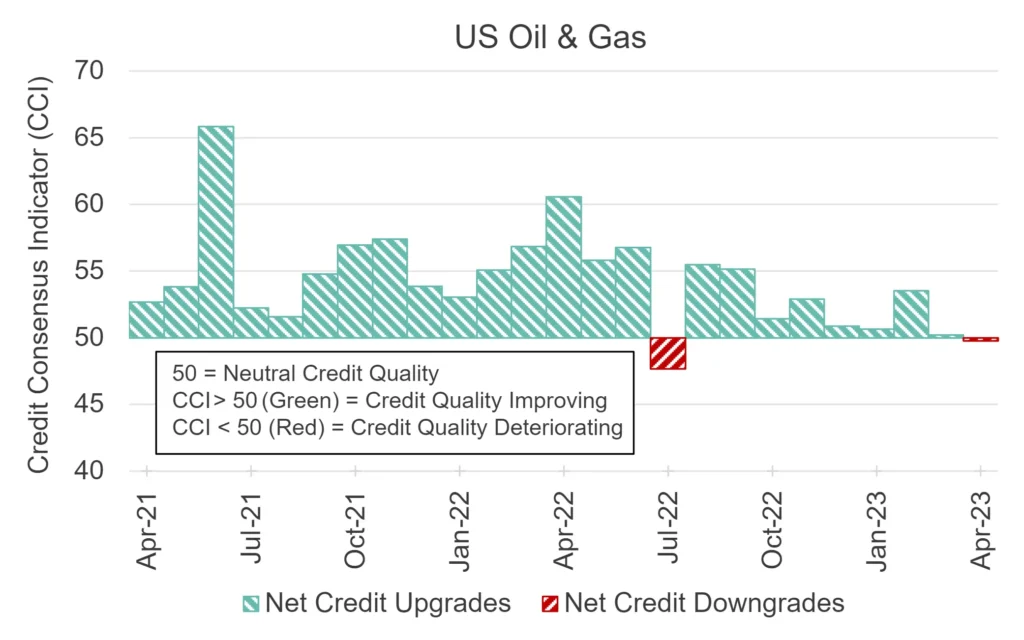
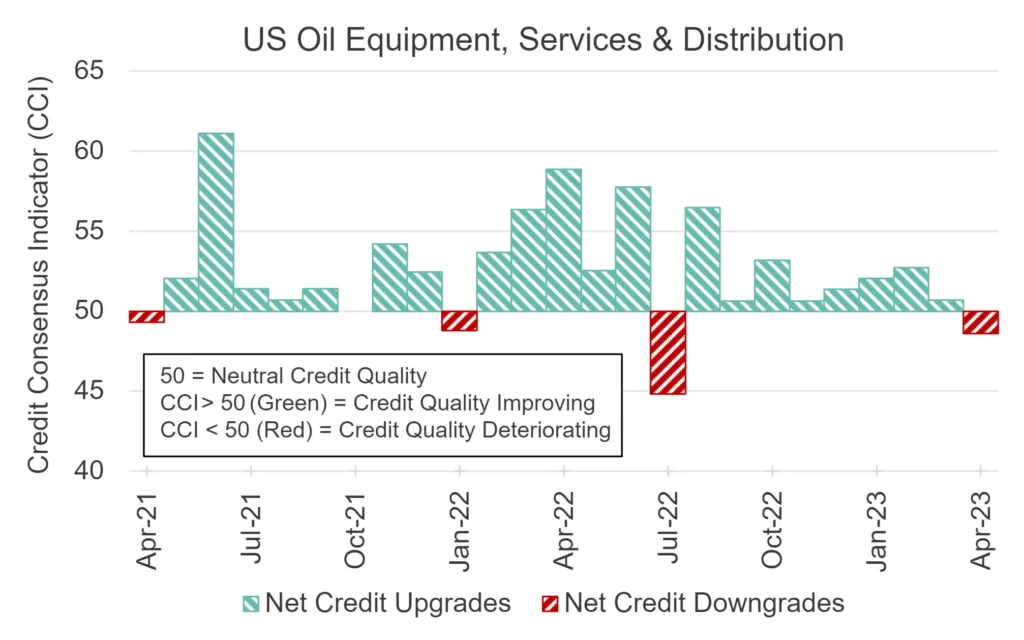
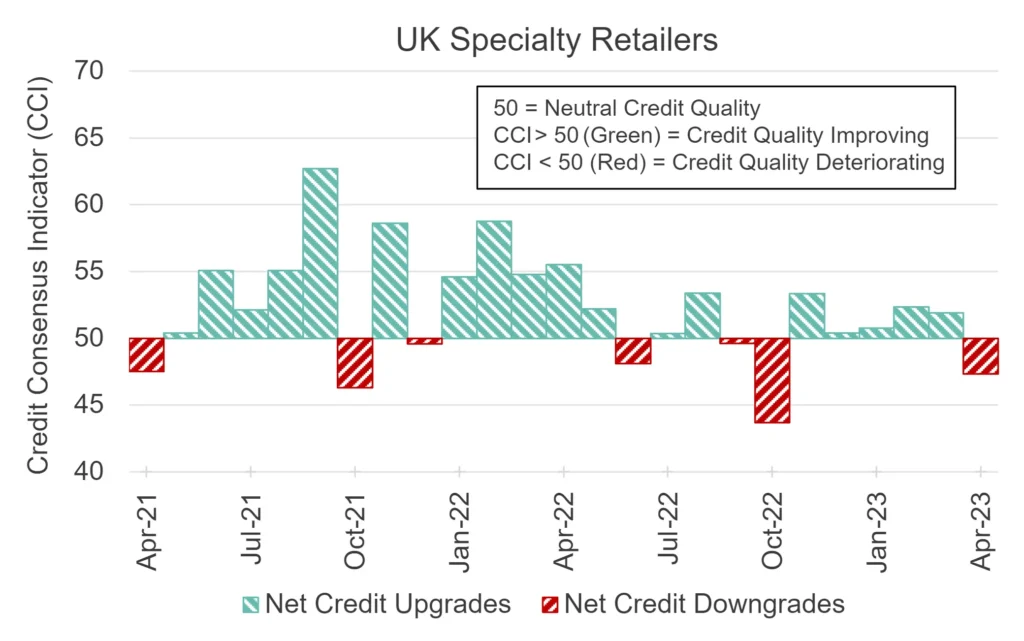
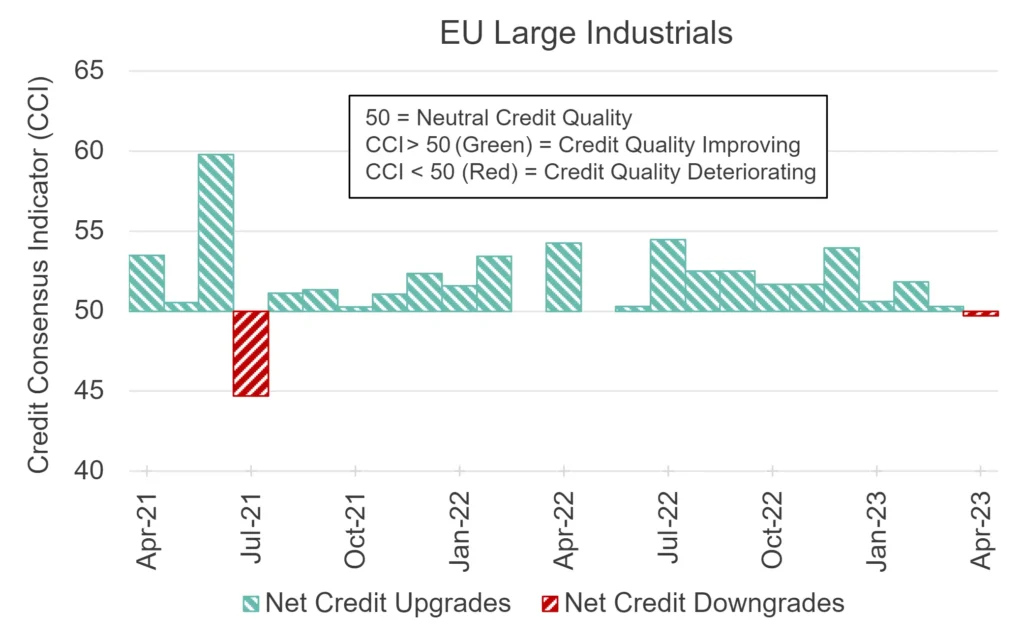
However, US and Global Oil & Gas appear in the negative turning point column (right). Industrial sectors – in the UK and EU – are also in the negative column.
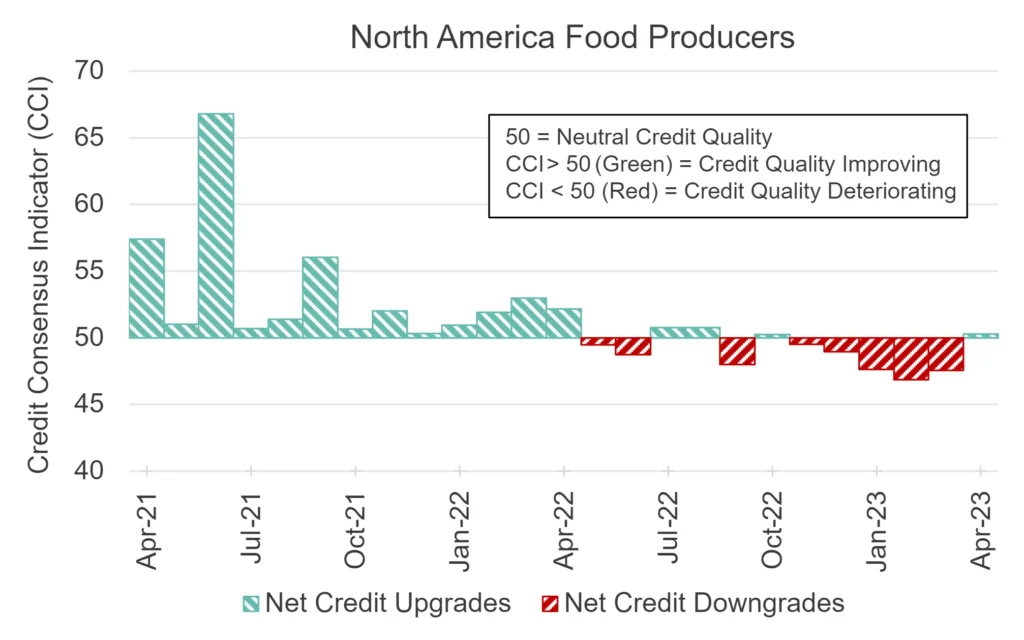
The following charts are based on the net balance between upgrades and downgrades which forms the Credit Consensus Indicator (CCI). The plotted indices are examples of some of the Industry and Sector Turning Points listed above.
Positive Turning Point:
Negative Turning Point:
US Sector PD Comparisons
US Fixed Line Telecomms Is Largest Monthly Drop
With economies and markets giving mixed signals, there is a lot of uncertainty about 2023 default rates. The table below compares average consensus default probabilities for a range of US sectors.
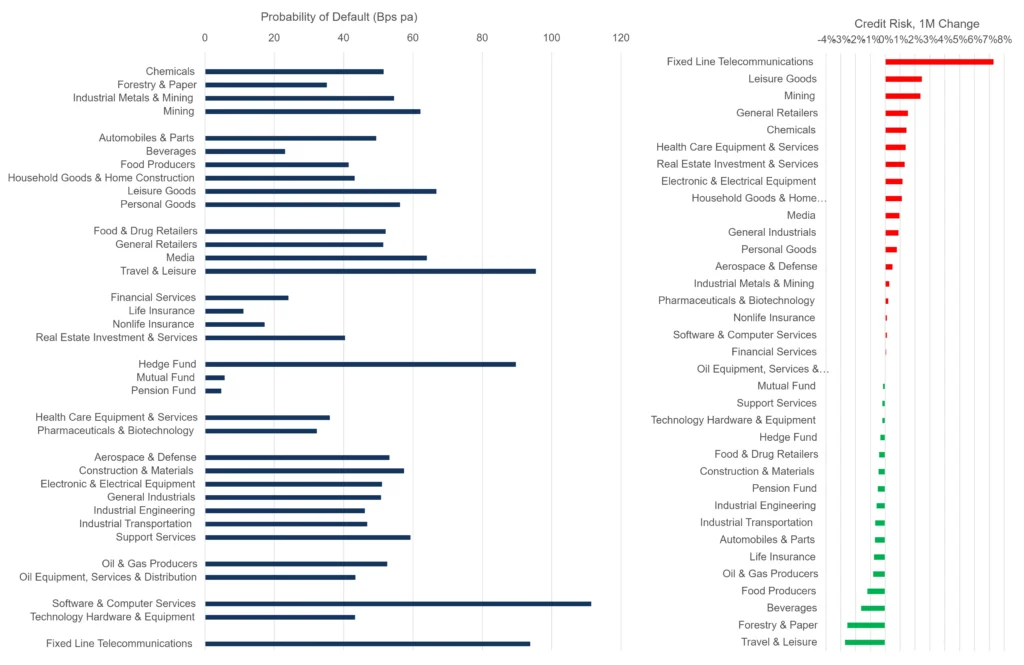
Insurance and Funds – apart from Hedge Funds – are very low risk. Travel & Leisure, Hedge Funds, Software, and Fixed Line Telecomms are highest in the 80 -120 Bps range. The mid-range includes Mining, Leisure Goods and Media.
Large sector increases this month include (always volatile) Fixed Line Telecomms, Leisure Goods and Mining. Improvements include Travel & Leisure, Forestry & Paper and Beverages.
In coming months, volatility metrics for these industries and sectors in each region will give a strong indication of future downgrades or default rates.
Credit Volatility
Various Percentiles Continue to Drop, Along With the Equity VIX
The following chart shows percentiles for credit index 6-month rolling volatility. For approximately 1,200 indices, rolling volatility shows the speed and scale of PD changes; these can give advance warning of changes in transition rates. The percentiles plotted here are the most sensitive to turning points in PD volatility.
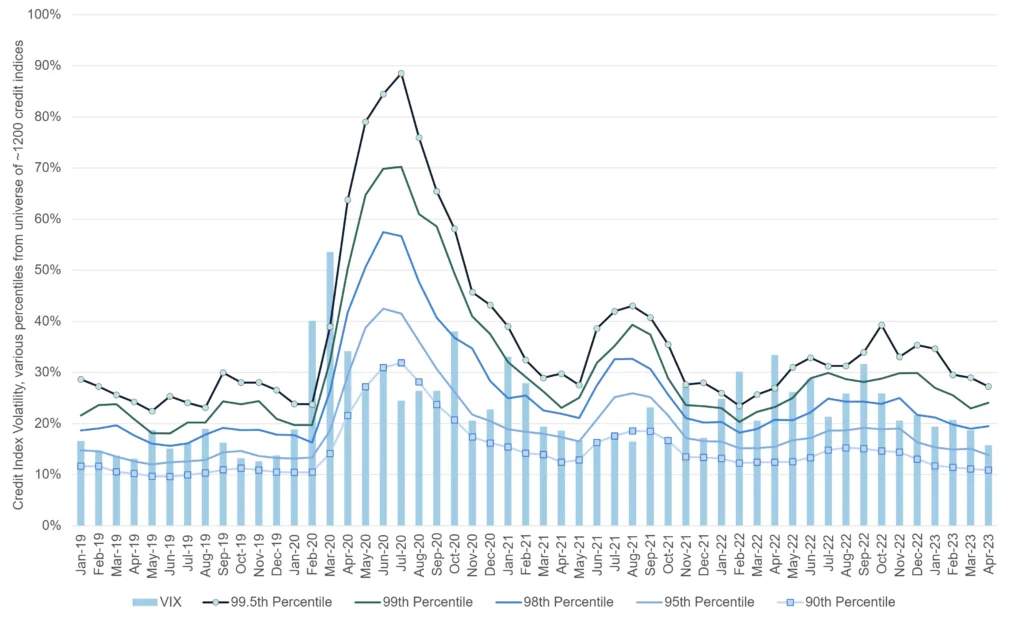
Across the CB index universe, the majority of percentiles continue to drop, along with the Equity VIX, but two have ticked up. Subdued volatility is consistent with the surprising resilience of many economies despite higher interest rates. The latest concern is the global shadow banking sector; “buy now pay later” has supported consumer spending but could mean that credit issues will emerge in consumer-facing sectors.
The next chart is based on cross sectional volatility (“dispersion”) i.e. the average range of estimates for single name estimates:
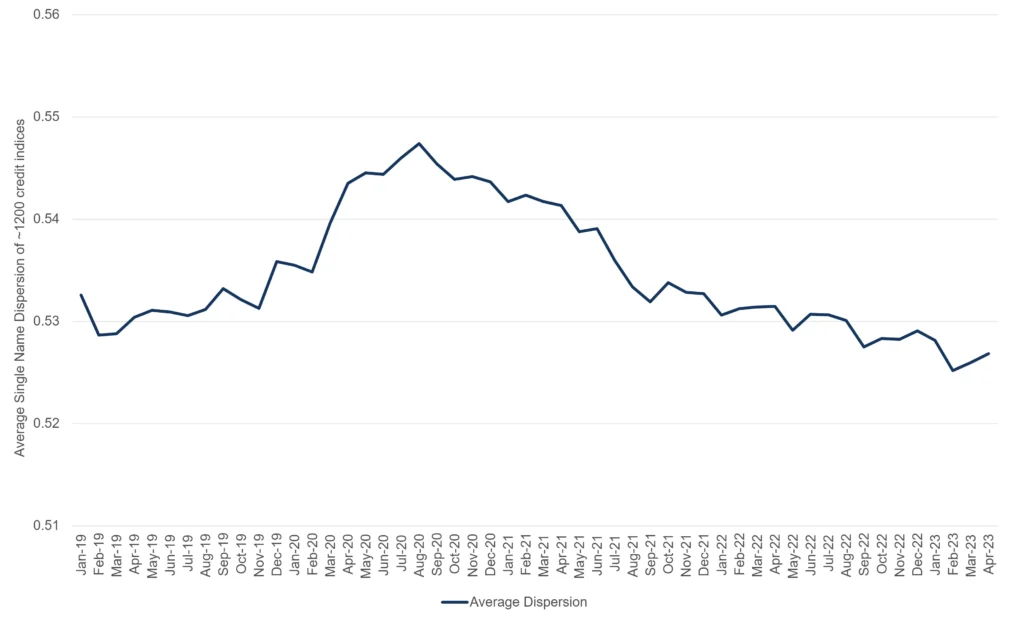
This again shows a trend decline2 since the start of the pandemic, consistent with the drop in rolling volatility plotted above.
Leveraged Loans
Global, US and UK Corporates Deteriorating, UK and Now Global Financials Improving
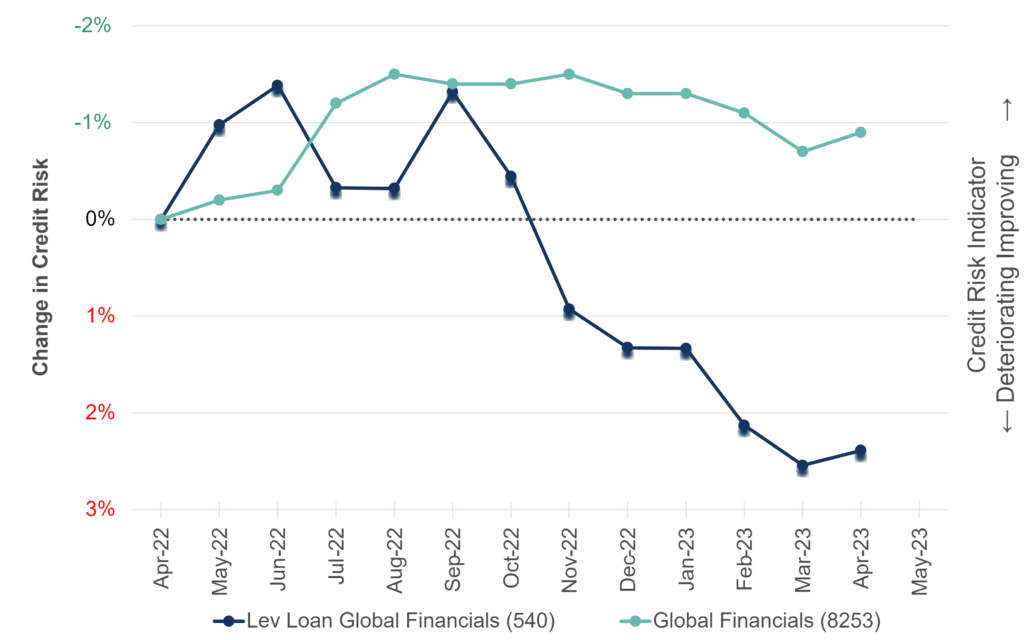
Leveraged Loans (LL) have growing issuance challenges as CLO managers – the main buyers of the $1.4trn asset class – face rising funding costs. This does not immediately affect LL credit risk but it could shut out some new (and usually more creditworthy) borrowers.
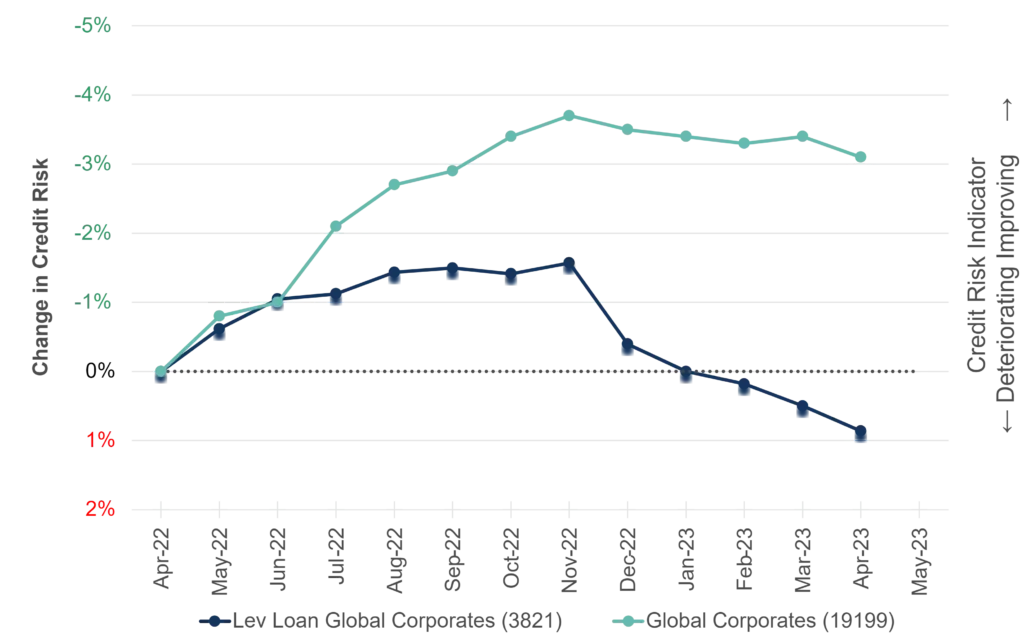
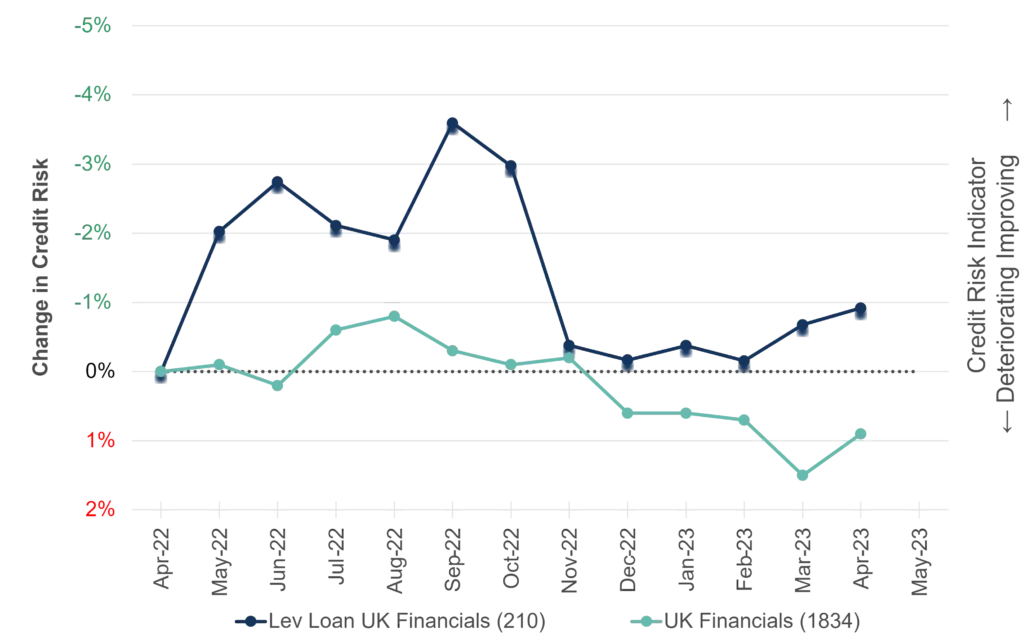
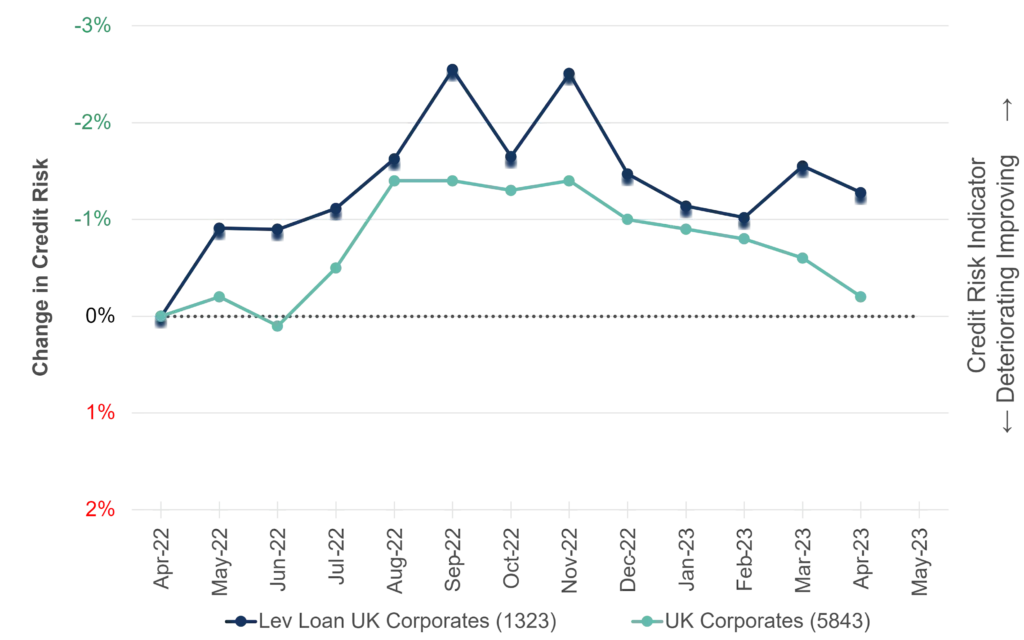
The following charts are based on a universe of 4,000+ Leveraged Loan issuers. The credit trends of these Leverage Loan issuers are being compared with their respective Credit Benchmark industry index.
Global Financials
Global Corporates
United Kingdom Financials
United Kingdom Corporates
United States Financials
United States Corporates
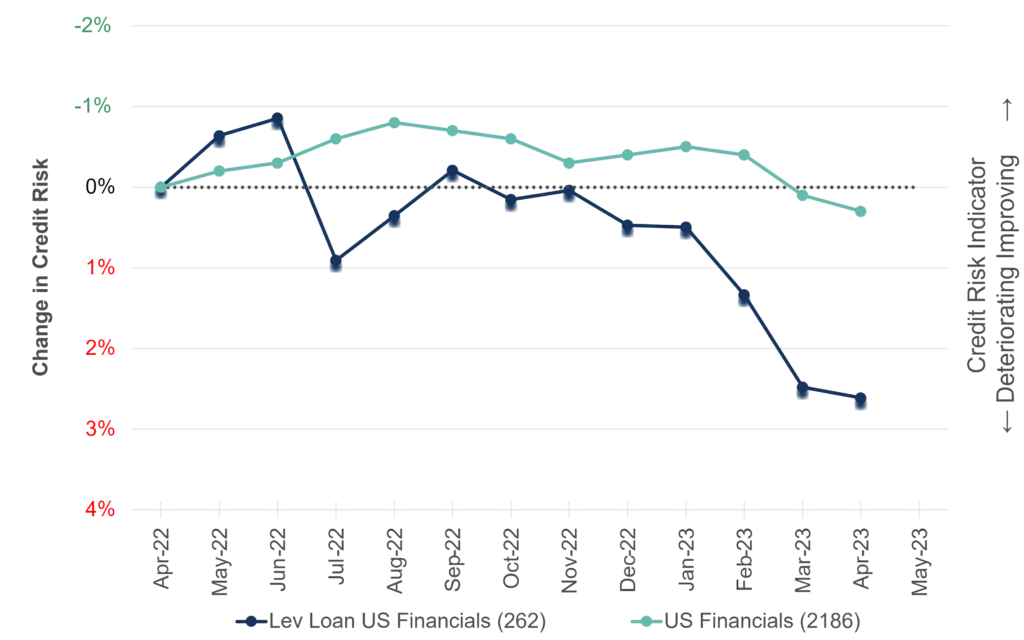
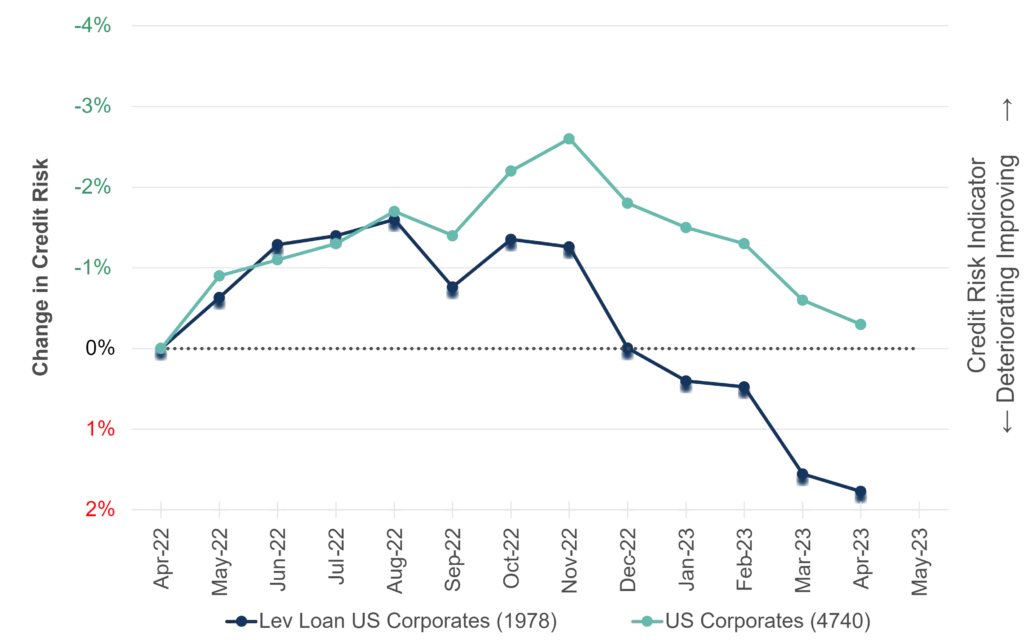
The main UK LL indices continue to buck the Global trend, with the Financial and Corporate indices outperforming the equivalent main UK indices; the UK Financials LL index is actually slightly up. US Financials have been the worst performer of this group of 6, both US Financials and Corporates continue to decline. Global Corporates and especially Global Financials continue to underperform the main (non-LL) index, but Global Financials show an untick in the latest month.
Various industry and sector Leveraged Loan indices are available on request.
Sovereign PD vs. Ratio of Financial to Corporate PD
Financial Sector Strength Relies on Government Credit
The IMF report that post-Covid growth has helped shrink public debt to GDP ratios in major economies (except China), but forecast a trend increase from 2024. Actual debt levels continue to rise; stubborn inflation due to supply chain damage, labour shortages and the Ukraine war have pushed up long term debt funding costs despite sustained global short rate hikes.
The US Debt Ceiling drama is partly a symptom of a growing debt overhang, and Q1 US Bank failures are a reminder that a robust banking system needs a well-financed Government. Growing concerns about shadow banking means that corporates are not immune to credit problems.
A recent paper highlights links between Sovereign default risk and the global financial system. The authors state: “…a substantial portion of the comovement among sovereign spreads is accounted for by changes in global financial risk…spillover effects of global financial risk are more pronounced for speculative-grade sovereign bonds.”
Various other studies have looked at the two-way links between Public and Private default risks. As a credible lender of last resort, Sovereign ratings need to be stronger than their domestic financial sector. (They typically are, with a few exceptions like Turkey.) If the financial sector of a country runs into problems, then domestic corporate borrowers are likely to face higher funding costs from international lenders. Conversely, a struggling corporate sector undermines the fiscal base and ultimately the Sovereign rating.
The following chart plots the current relationship between consensus Sovereign credit risk and the Financial / Corporate credit risk ratio, for a large cross section of countries.
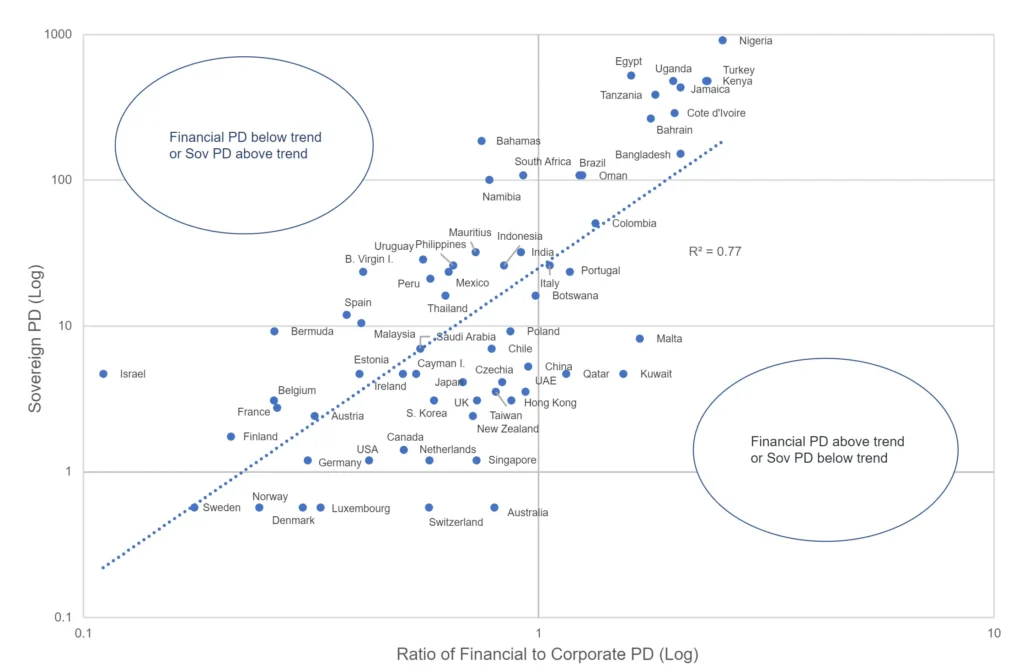
The ratio of Financial to Corporate PDs is used to filter out small samples and to adjust for the global spread effect mentioned earlier. Countries in the upper left quadrant either have a Financial PD below trend, a Corporate PD above trend, or a Sovereign PD above trend. The Sovereign PD for Egypt, for example, may be too high, the Financial PD too low, or the Corporate rating too high. Countries in the bottom right quadrant are in the opposite group – so for example the Financial PD for Australia may be too high given the Sovereign and Corporate risk ratings. For Australia the x-axis value is below 1. This means that along with other strong global economies like Germany, USA and UK, Australia has a Financial PD that is less than the Corporate PD.
Comparison with similar economies may shed more light on these anomalies, but the core messages are clear: (1) the credit rating of a country’s financial system is heavily influenced by the credit rating of the Sovereign, and (2) in countries with the strongest credit, the Financial sector is stronger than the Corporate sector.
US Regional Banks
Prolonged Deterioration Setting In?
There have been fresh concerns about the US Regional Banking industry, including rumours of short selling bans. The Credit Benchmark US Regional Banks index (105 constituents) below shows a major deterioration in the past two months with the latest month showing only downgrades. And coming after last month’s large net negative, this may be the beginning of a sustained downtrend.
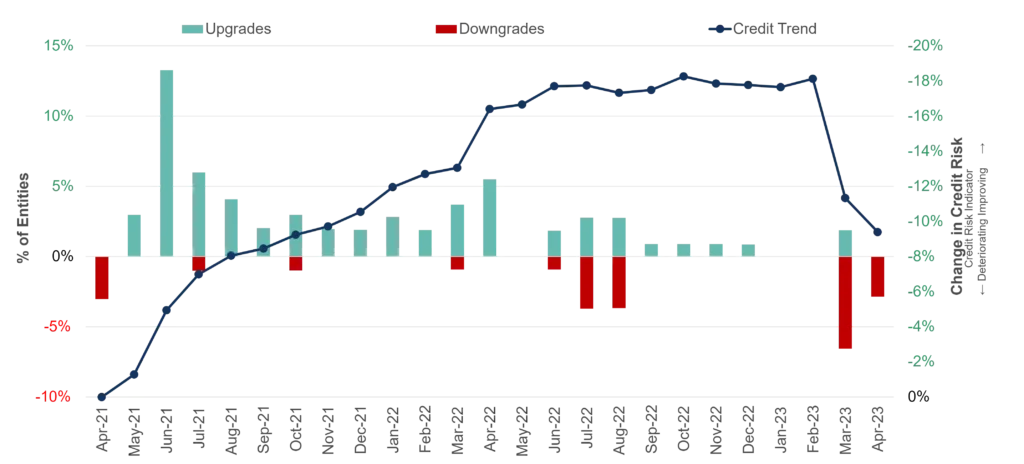
More generally, the US Financial sector has been overall stable in recent months. The charts below show 1Y credit trends and current credit distributions for US Financials, Financial Services and Banks indices.
Credit Trend
Credit Distribution
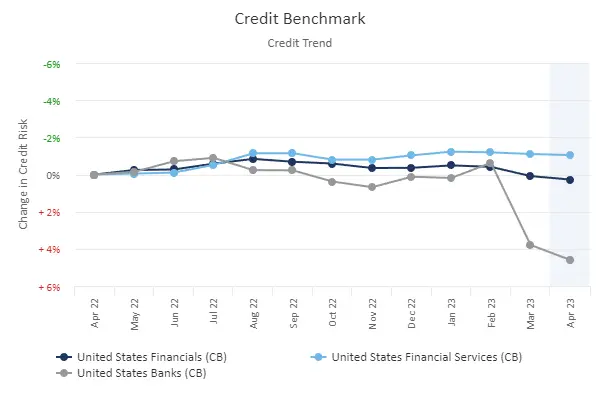
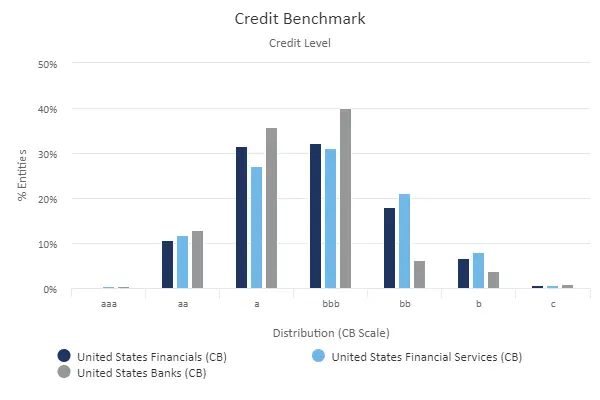
US Financial Services have kept pace with the broader US Financials index, but US Banks broke away from the pack in Mar-23 as regional bank worries spread across the broader sector. However, ~90% of US Banks are still in IG credit categories.
US Retail
US General Retailers Credit and Equity Is Down
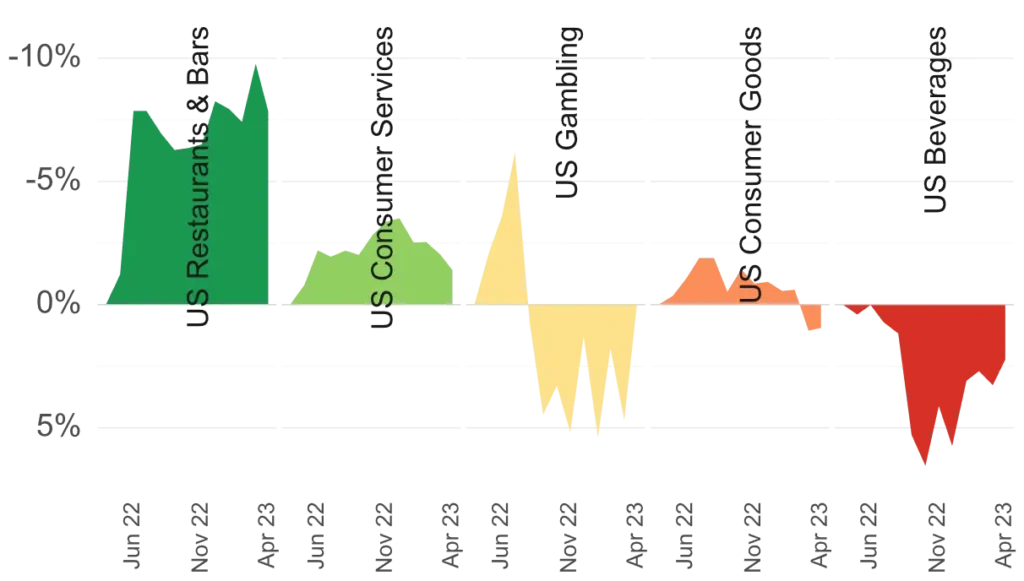
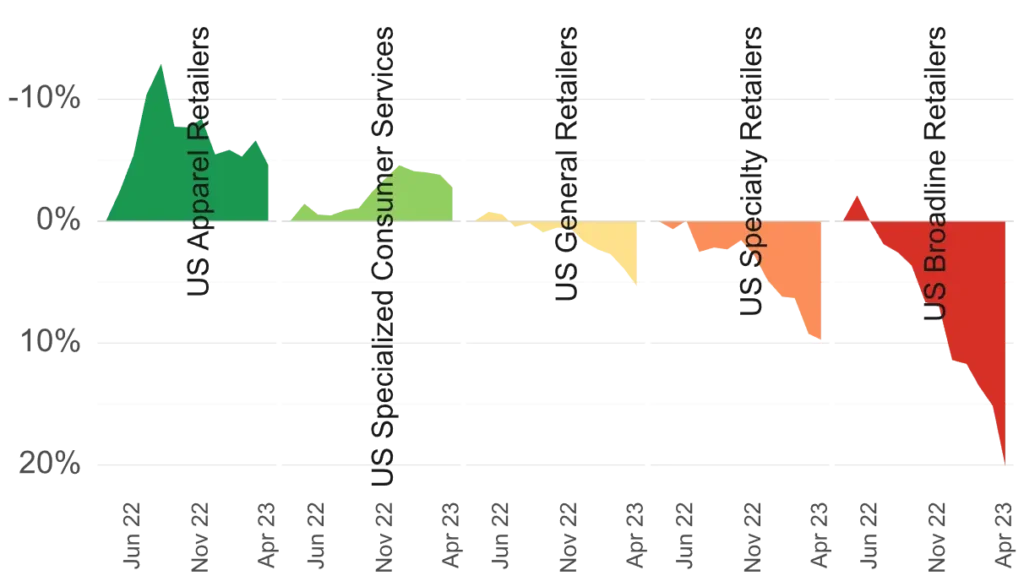
With growing concerns about shadow banking and consumer credit, it is useful to compare recent equity and credit trends for consumer-facing sectors. Within the S&P500 indices, Casinos and Gaming are the best performers, up 22% YTD. Internet & Direct Marketing is up 17% while Consumer Discretionary Retail is close behind, up 16%. Apparel, General Merchandise and Speciality Stores are all down by a few percent.
However, US Apparel Retailers show the largest credit improvement in the retail sector, followed by Restaurants and Bars. General and Specialized Consumer Services both also show credit improvement. In contrast with a stellar equity performance, US Gambling shows a modest credit deterioration of about 5%. Sectors with credit in line with their equity performance are General, Speciality and Broadline retailers – all negative, with the latter down nearly 20%.
The following charts show credit trends for various US Retail sectors.
Conclusion
Consensus Credit volatility has been subdued in recent months, and credit trends shown here suggest that major economies have avoided the worst-case scenarios for H1 2023, corroborated by stronger economic numbers from the UK and US. However, the US debt deal will curb spending and UK interest rate hikes have not yet fully hit most mortgage holders, so H2 may be choppier, while the EU growth is still adjusting to the Ukraine war and ECB hikes. And there are clear signs of deterioration in specific US sectors, such as Oil & Gas (before the latest OPEC move), Regional Banks, Retail and Leveraged Loans (especially Financials).
Enjoyed this report? If you’d like to see more consensus-based credit ratings, mid-point probabilities of default and detailed analytics on 80,000 public and private global entities, please complete your details to request a demo or coverage check:
1The CCI tracks the monthly net level of credit upgrades / downgrades for a given sector, based on the combined risk views of expert credit analysts at over 40 global banks. A CCI score of 50 indicates an equal number of upgrades and downgrades; over 50 is improvement; under 50 is deterioration.
2The actual plotted range is small (about 4% of the average value). Changes in dispersion are more marked at the single name level – for example, when a legal entity is downgraded, the range of PD estimates usually increases.
