Credit Benchmark’s US Default Risk Outlook draws on an extensive database of 105,000+ unique Credit Consensus Ratings (CCRs). These CCRs represent the internal risk views of expert analysts at the world’s leading banks – a previously untapped source of risk intelligence. 90% of the entities with CCRs are not rated by a major credit rating agency, meaning these projections offer a new and significant capacity for analysing default risk.
Although this report focuses on US Industries, the methodology can be applied to the broad and highly representative dataset of 105,000+ CCRs (see here for Default Risk Outlook on UKIndustries and here for EU Industries). The default projections can be customized for our clients to match their own classification schemas and align more accurately with their portfolios and exposures.
Vigilant risk management is vital when navigating an unpredictable economic climate. With broader, deeper, and more frequent analytics than previously available, Credit Benchmark is now able to offer the market a comprehensive and differentiated view on default risks.
If you would like a free and fully confidential analysis of the default risk projections of your own portfolio, we encourage you to get in touch here.
Table of Contents
Overview: US Macro Risk Landscape
“Waiting two years for a recession that hasn’t happened”.
Despite loud H1 calls for rate cuts, the Fed held the line. Biden’s Inflation Reduction Act was – ironically – partly responsible for persistent wage inflation pressures. But for 2025, a sharp growth slowdown looks likely, with Jerome Powell indicating that short rates have peaked. The election is a key binary issue: tax and spending spikes or drops will follow, but taking on the worst budget deficit in the G7 is a challenge for either winner. Increased protectionism could boost some US industries, but fossil fuels continue to benefit as industries backpedal on green energy and electric vehicles.
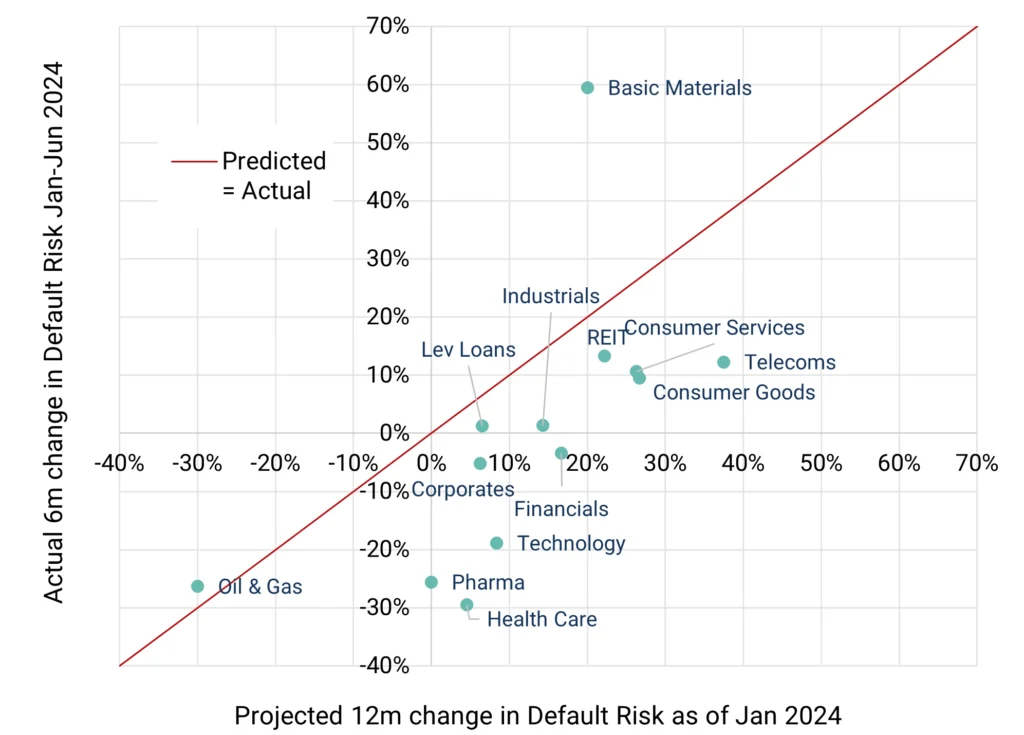
Previously, our January 2024 default risk projections for US industries had forecast a modest deterioration this year, but the strong economy in H1 has avoided that. The exception is Basic Materials, overshooting the 12-month projected increase in less than 6 months due to commodity price declines, reflected in poor earnings. Latest 12m projections show little change in Corporates and Financials average default risk, but trends remain modestly negative for Basic Materials as well as Technology, Telecoms, and Health Care. REITs and Leveraged Loans have been problem sectors throughout 2023/24, but there are signs that default risks there are stabilising. Oil & Gas improved in H1 2024 in line with projections, but the next 12 months looks more challenging if Chinese growth remains sluggish, and OPEC maintains current output levels.
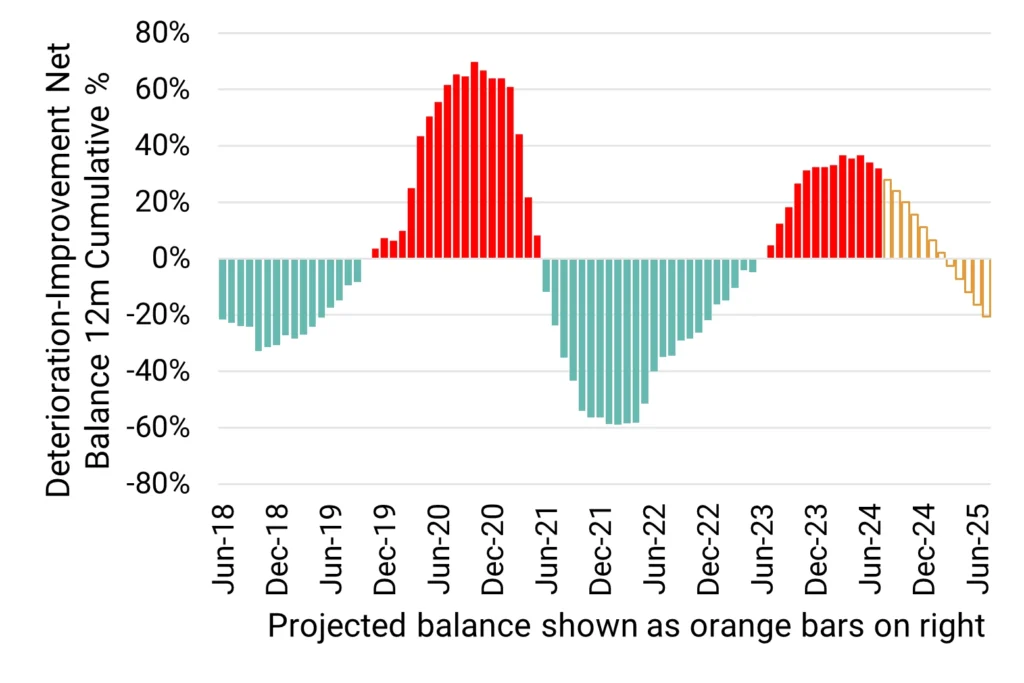
S&P expect high yield default rates to peak this year and drop into 2025, but bank-based projections show non-investment grade default risks continuing to rise in H1 next year. All industries currently show more deteriorations than improvements, so default rates could continue to rise in Q3/Q4 of 2024, but most industries are projected to move to an improving balance by early 2025.
How have January 2024 forecasts held up?
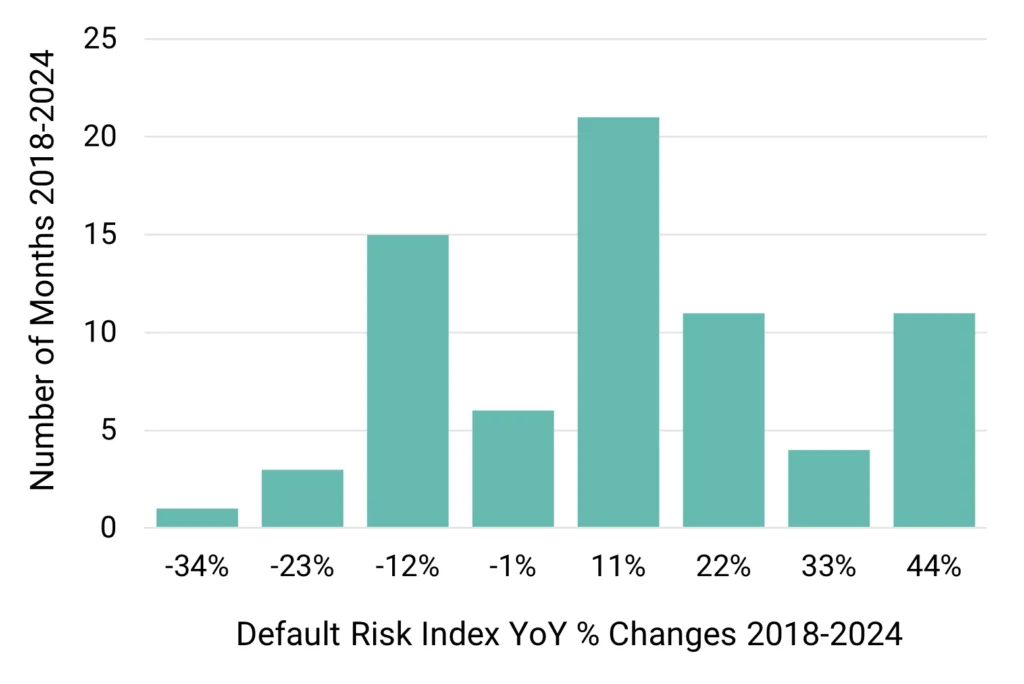
Most sector projections were correct on default risk direction, and sector rankings for 12m projection vs. 6m outcomes show reasonable alignment. But average default risk has barely changed over 6 months against an expected 10%+ increase. Technology and Health Care have been more robust than expected; Basic Materials deteriorated well beyond expectations.
Key Takeaways
Average default risks show little change over the past 6 months, so the 12-month forecast deterioration may be over-cautious. However, there are some noticeable sector mavericks:
Basic Materials has already deteriorated far more than expected (60% vs. 20%)
Telecoms is forecast to deteriorate by 40% in 12 months; default risk has so far increased by just 10%.
Consumer Goods and Services have both deteriorated by about 10%, but full year expectations are for 25%.
Oil & Gas has improved by nearly 30% in 6 months – aligned with the forecast but faster than expected.
Financials have dodged bad debt problems and benefitted from higher interest rate earnings, showing no change so far against a predicted 15%+ deterioration.
Health Care (and Pharma) improved, against expectations of modest decline.
Sector changes in rank order are broadly aligned with expectations, but the robust US economy has so far avoided the general 10%+ deterioration that was expected at the start of the year. A Fed move to rate cuts in Q3/Q4 suggests a weaker economic outlook, so a general credit deterioration may become an issue before year end.
2024/25 US Default Risk Forecast
Default risks for overall Corporates and Financials look stable as rate cuts cushion the slowdown. But Telecoms and Tech could have a difficult 12 months. Biden boom fades, but rate cuts compensate by H1 2025. Election result crucial for fiscal outlook and Health Care in particular, but global outlook is a mild negative for Basic Materials and Oil & Gas.
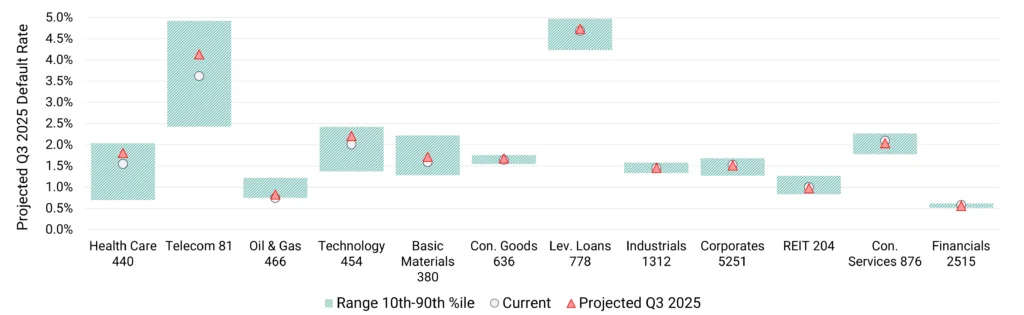
Credit Benchmark’s projected default rate for Q32025
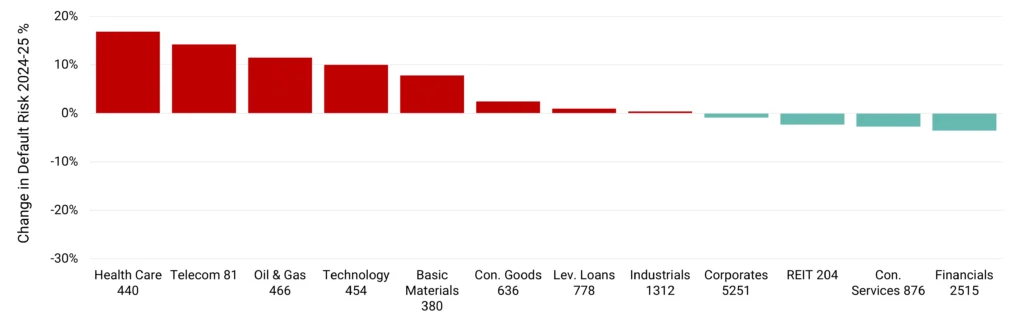
Change (%) in the probability of default (PD) during 2024/25
Key Takeaways
We predict US default^ risks to show little net change over the next 12 months as rate cuts cushion the impact of a slowing economy.
Basic Materials, Health Care, Telecoms, Oil & Gas and Technology are expected to show increased default risk by mid-2025; but there is a modest chance that Health Care improves if Democrats win the White House.
Industrials, Corporates, Leveraged Loans and Consumer Industries are forecast to show little change.
Financials and REITs are expected to show a slight net improvement.
While Oil & Gas is expected to show modest deterioration, this is based on slower growth in China and the US, as well as OPEC maintaining a high output level.
The range of possible US default rates is narrower compared with previous projections, with the exceptions of Healthcare and Telecoms
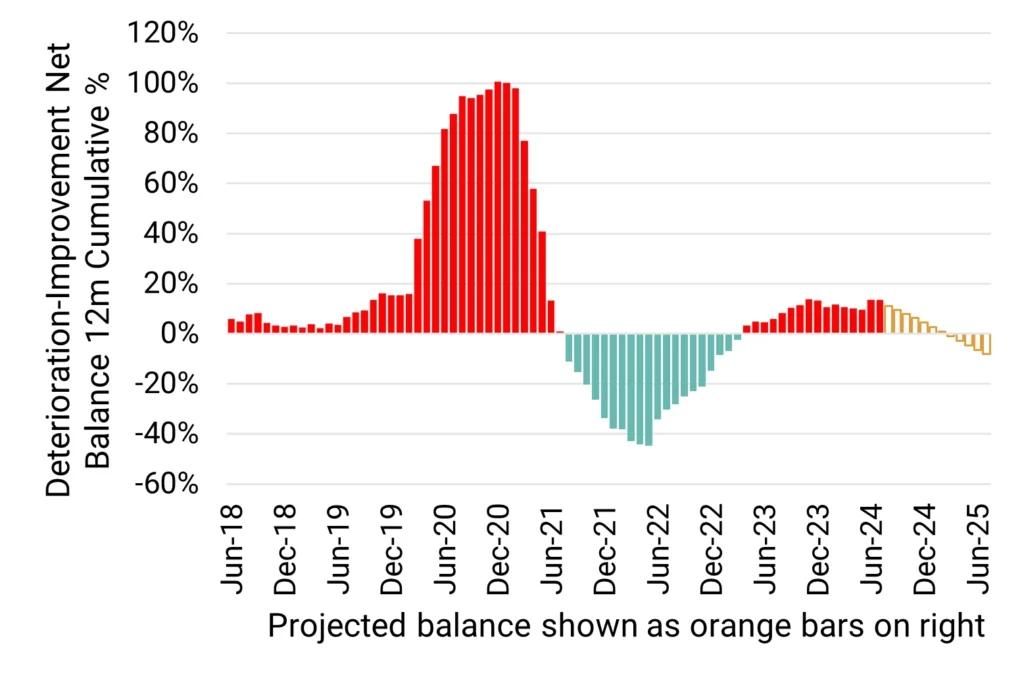
Outlook for US Non-Financial Corporates*
Default risks stable as rate cuts cushion impact of slowing growth. Election result critical to some sectors e.g. Health Care.
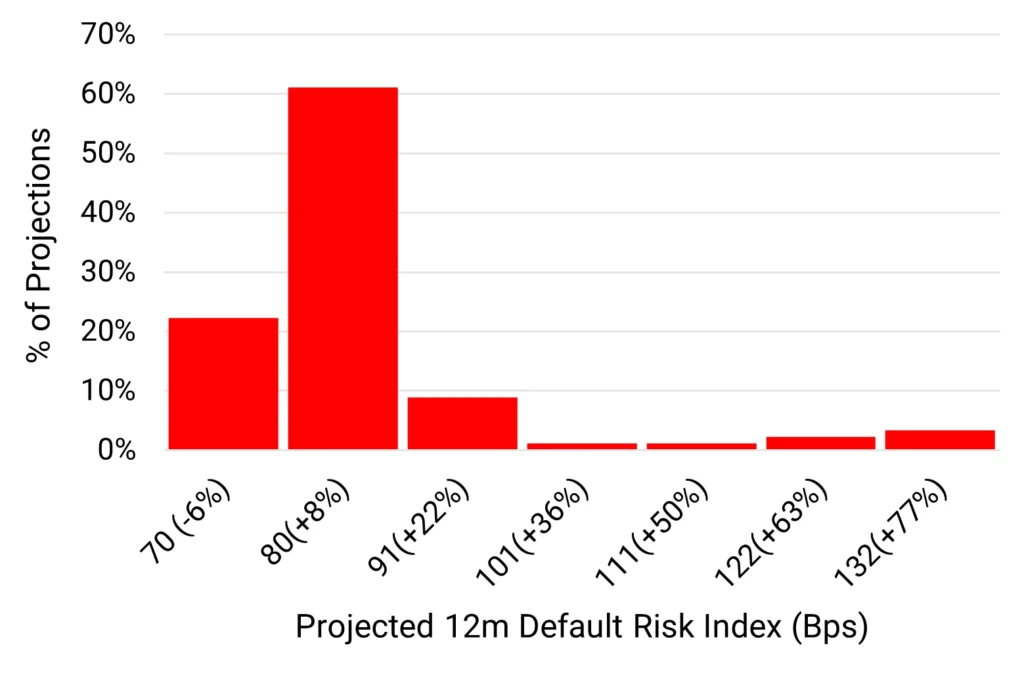
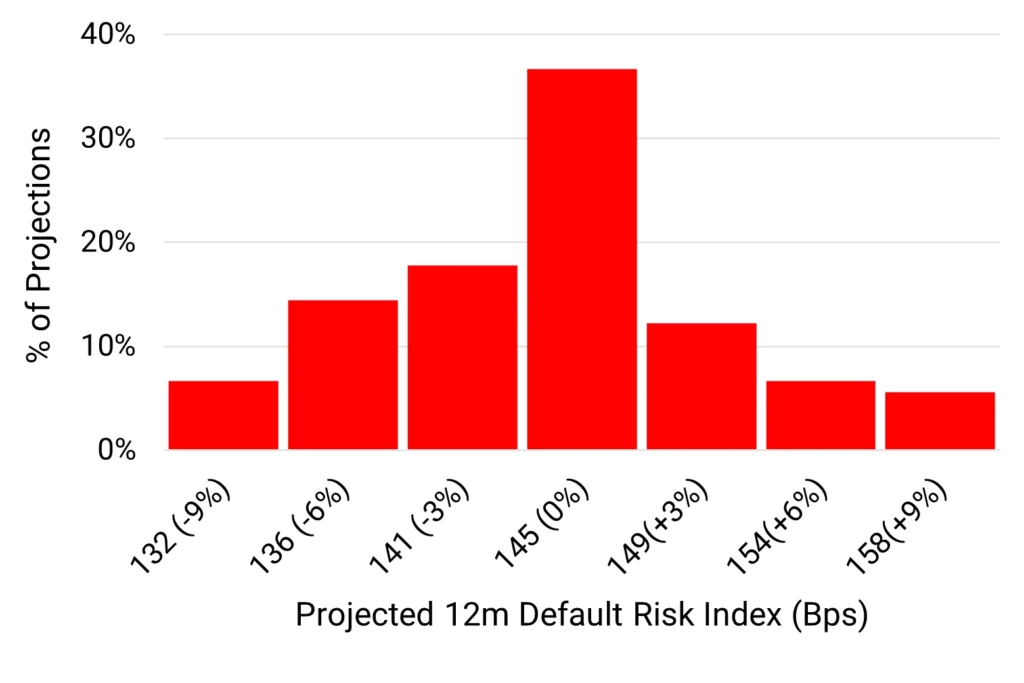
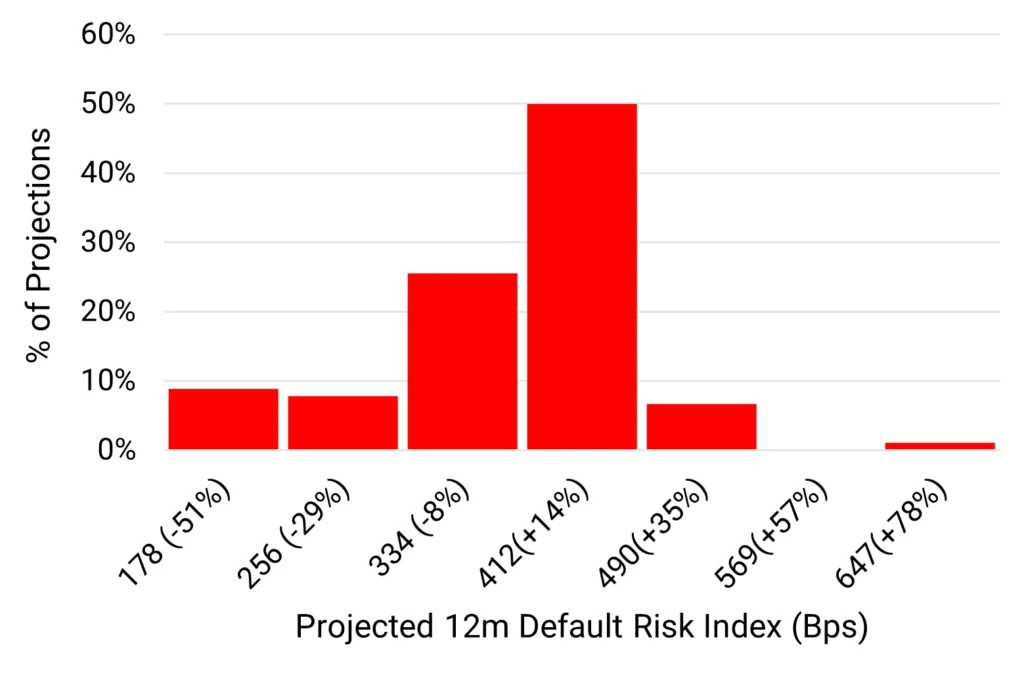
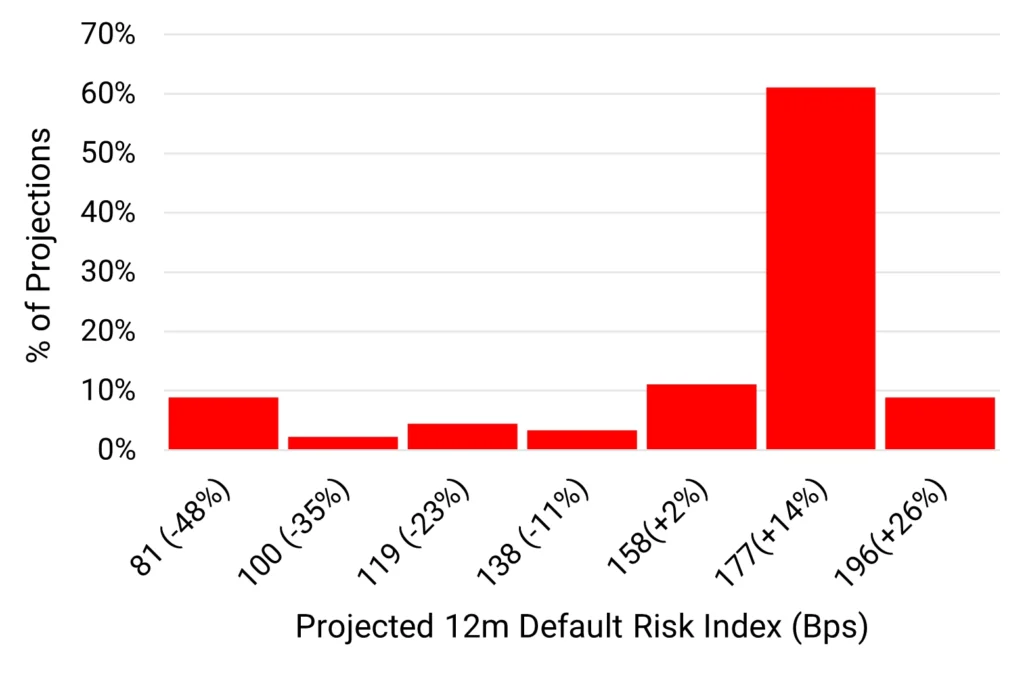
Projected 2025 default rate distribution
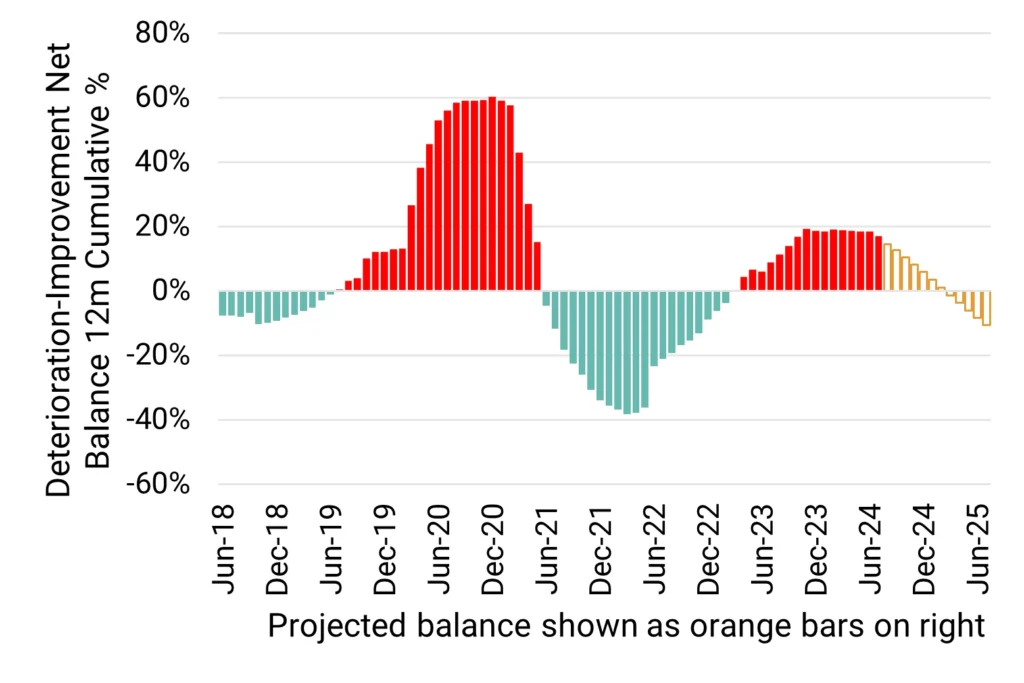
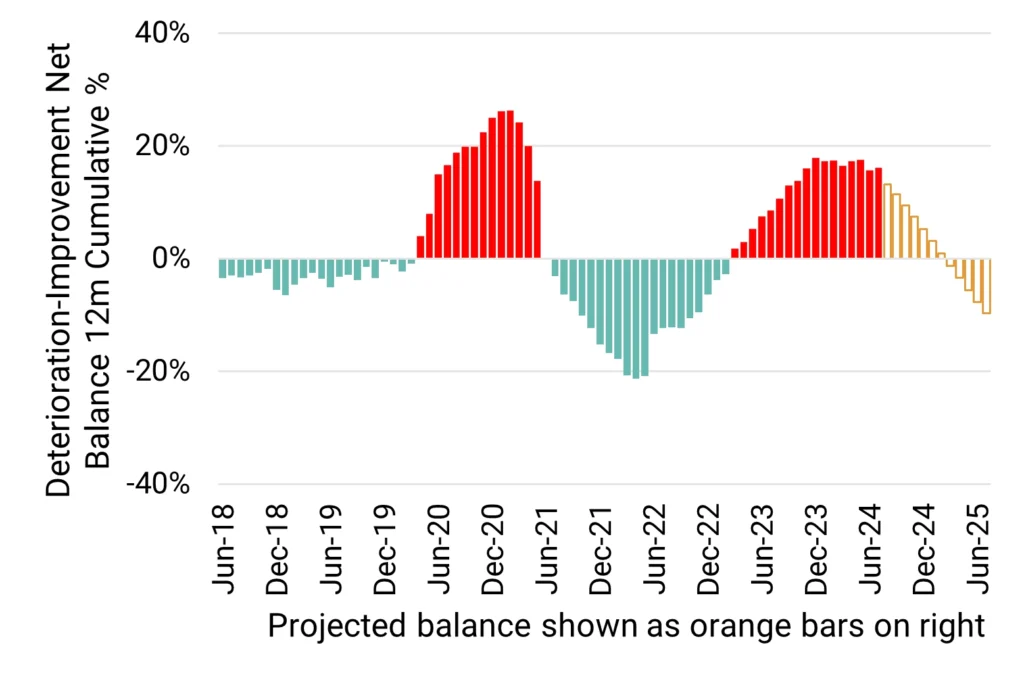
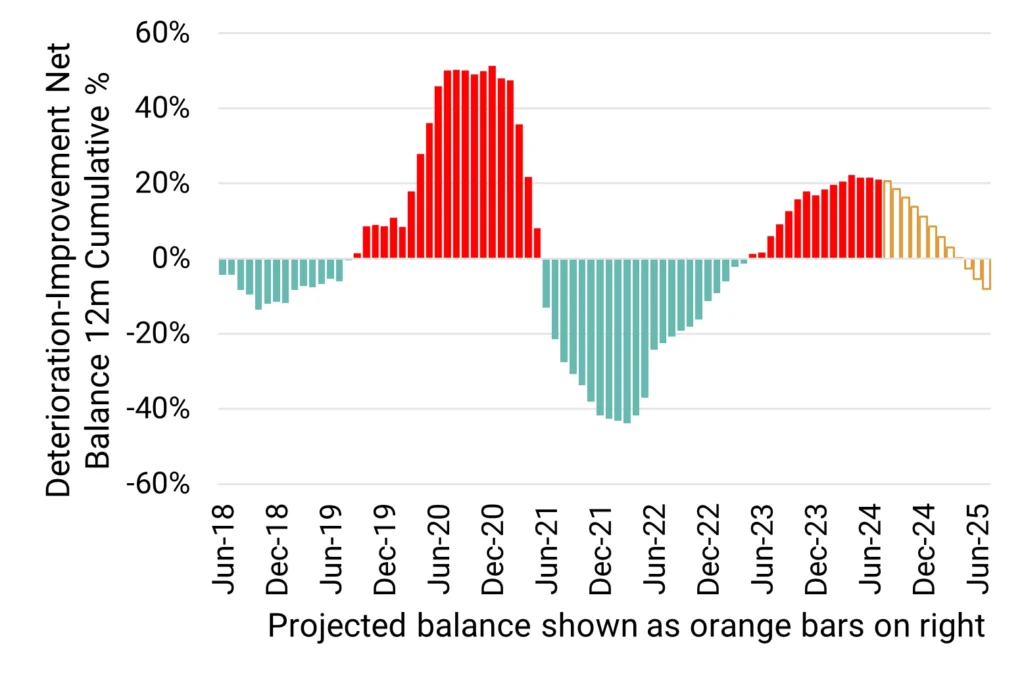
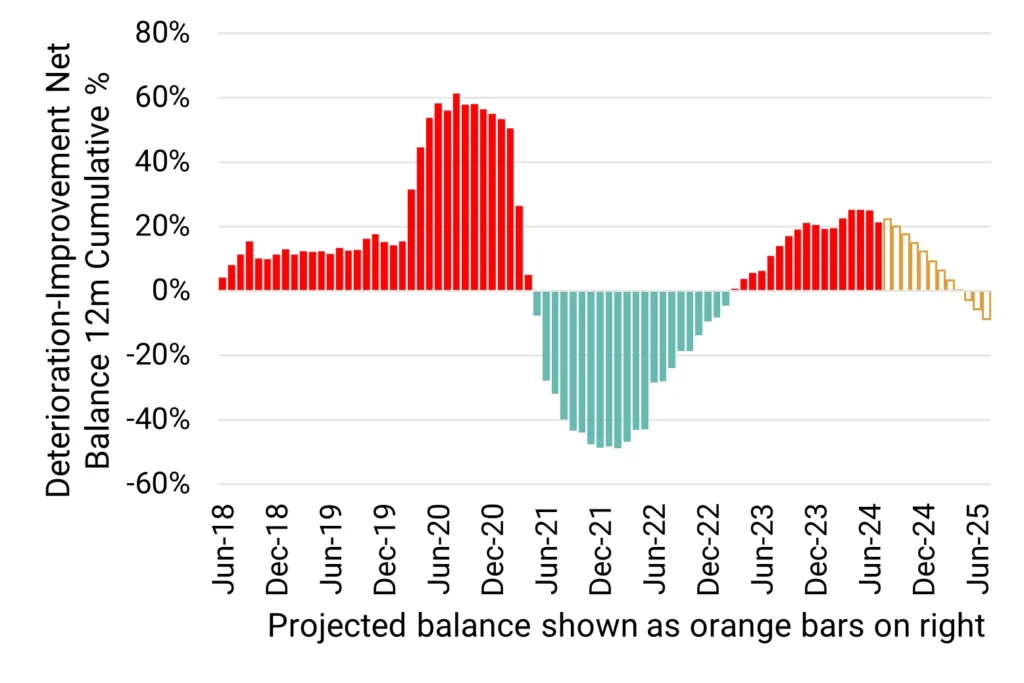
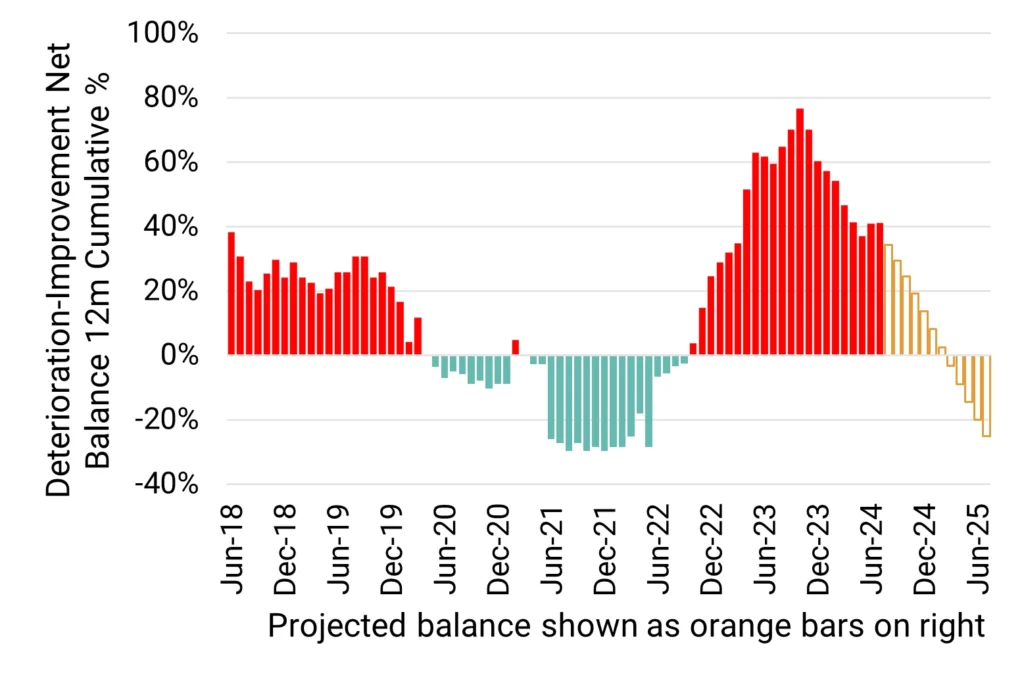
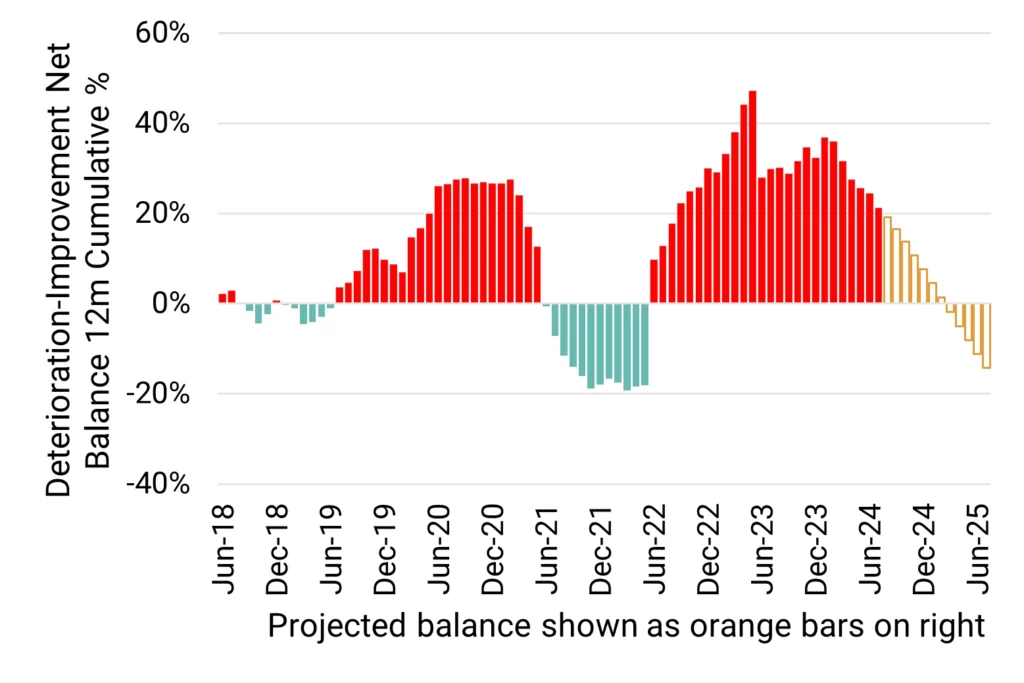
Deteriorations vs improvements % of total
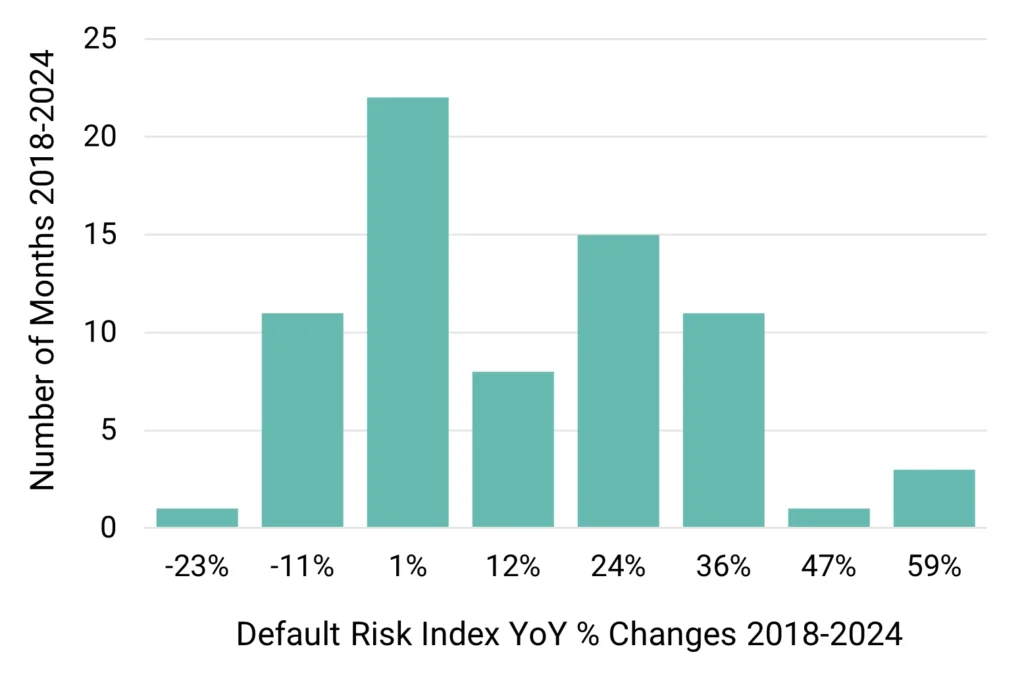
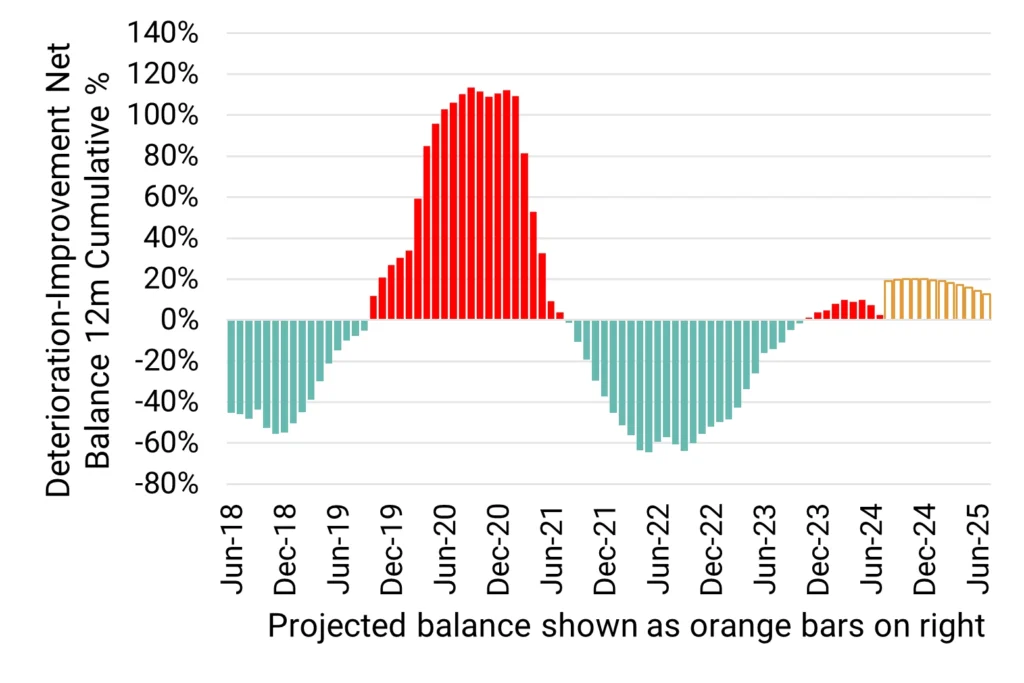
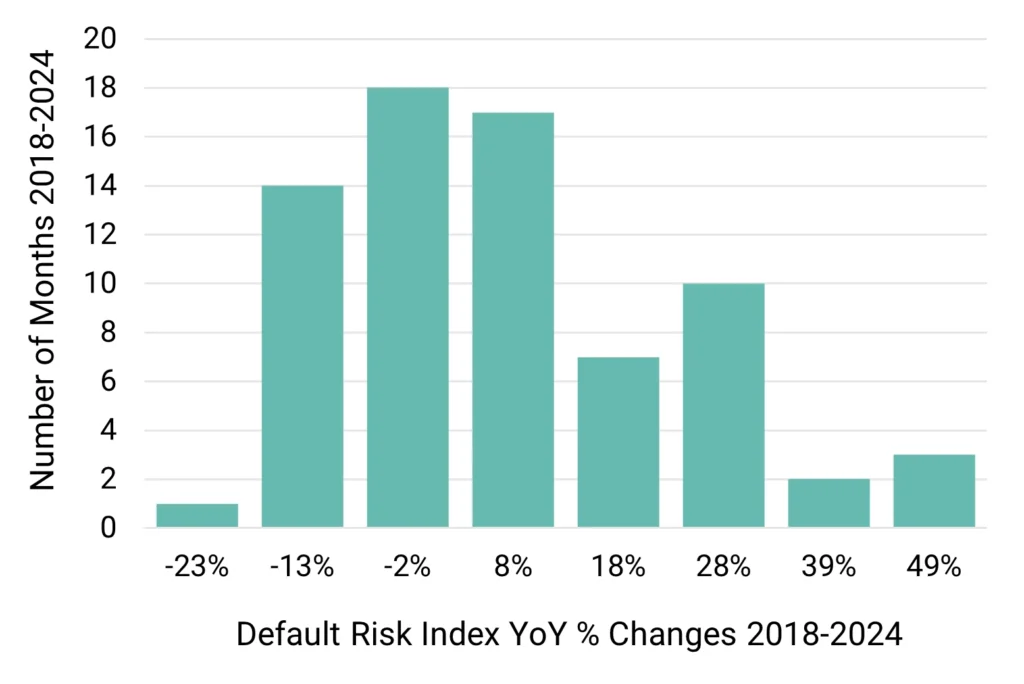
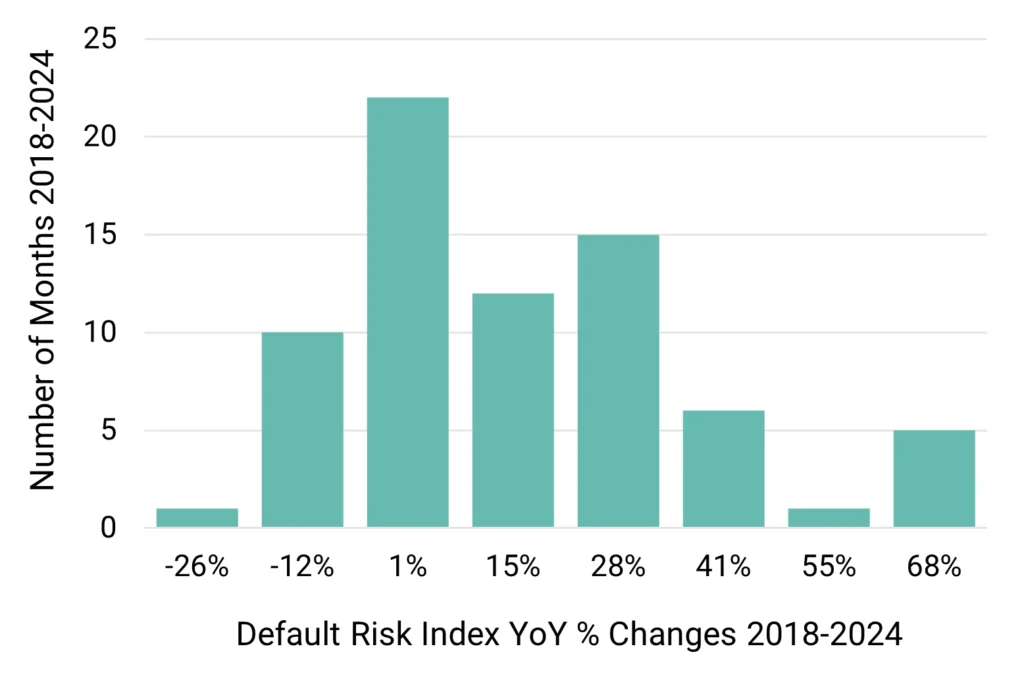
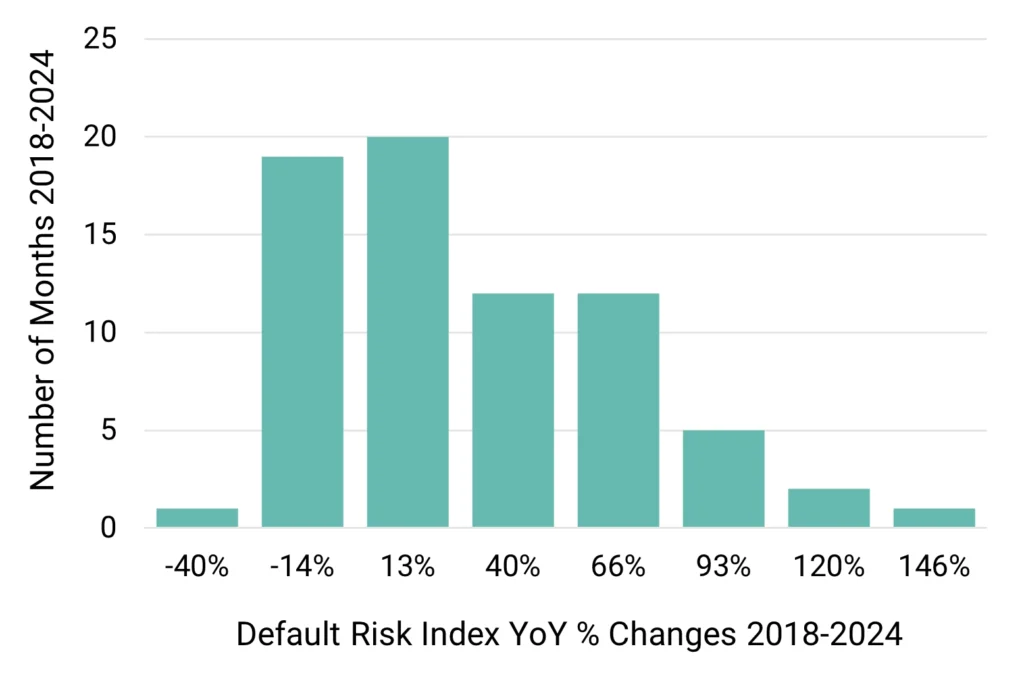
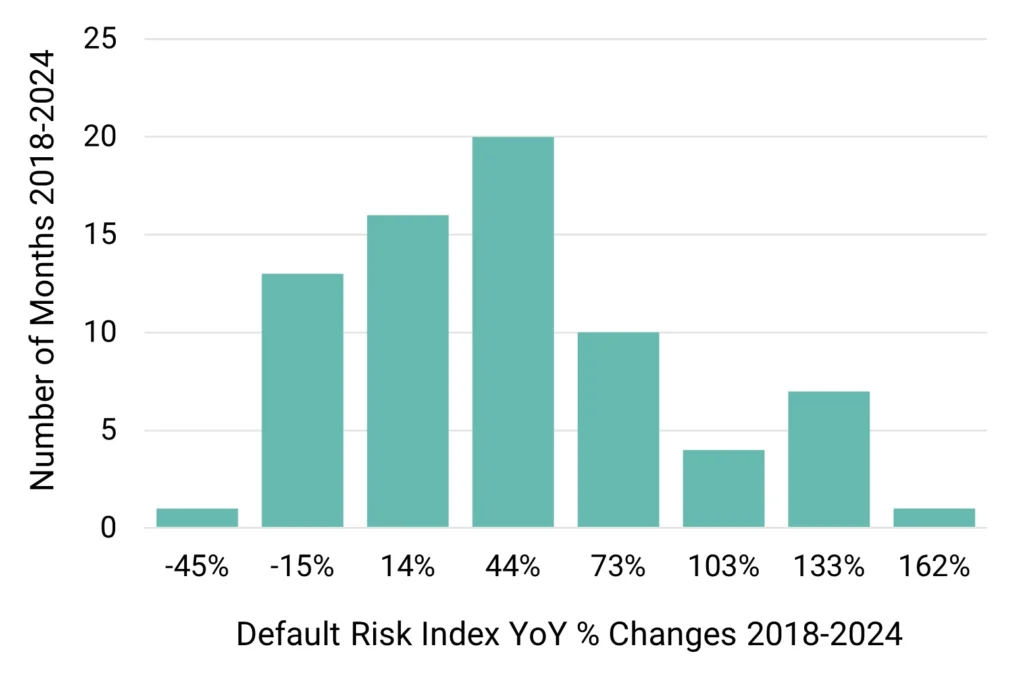
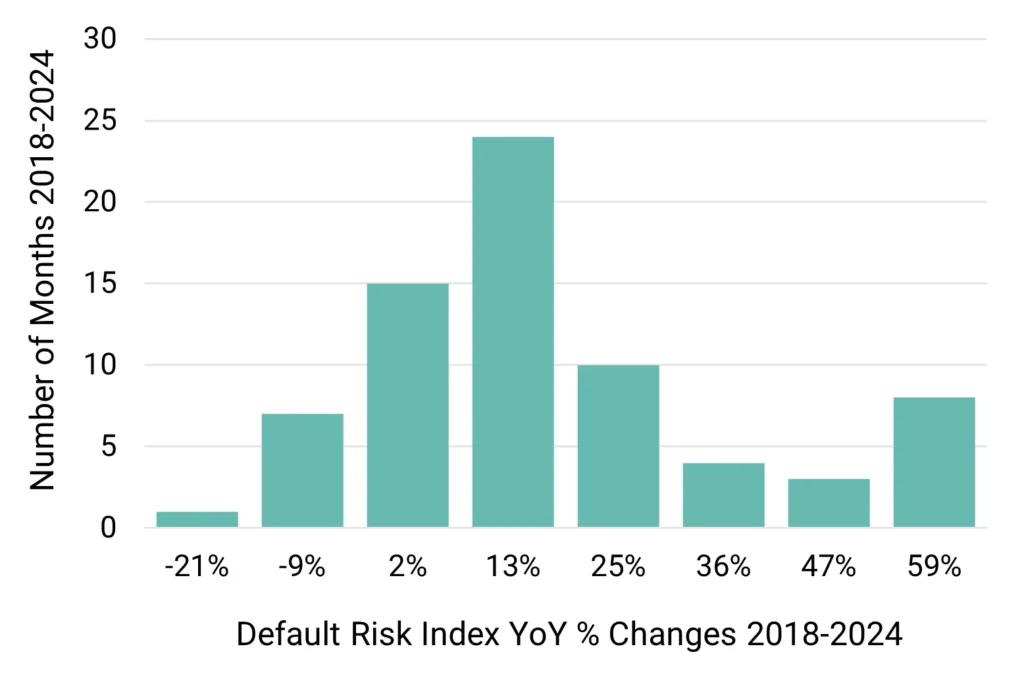
12M PD change range 2018-2024
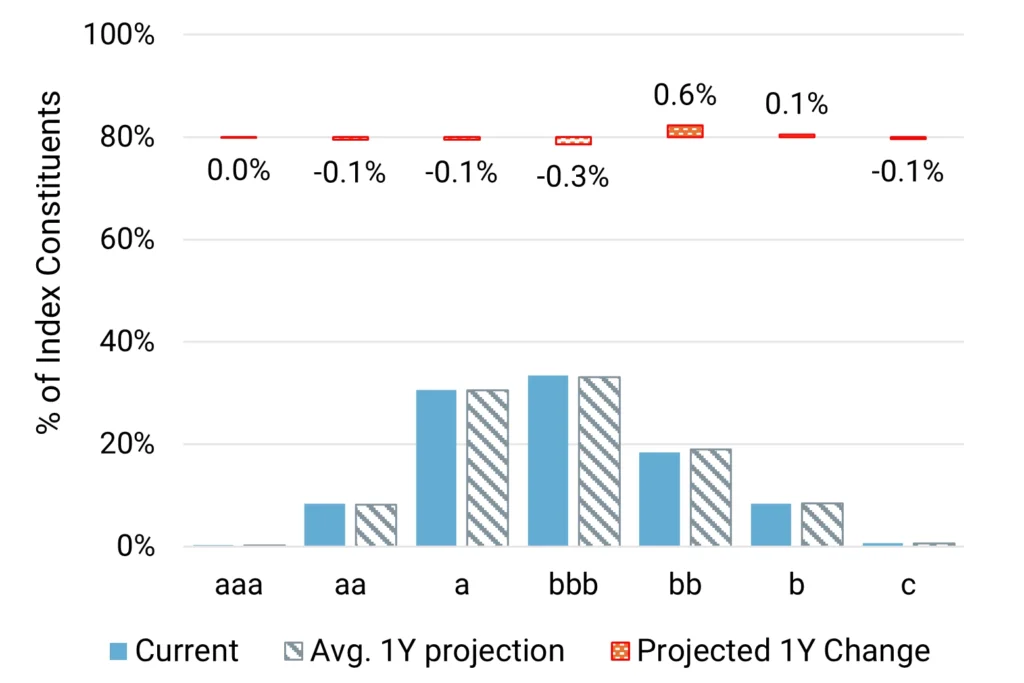
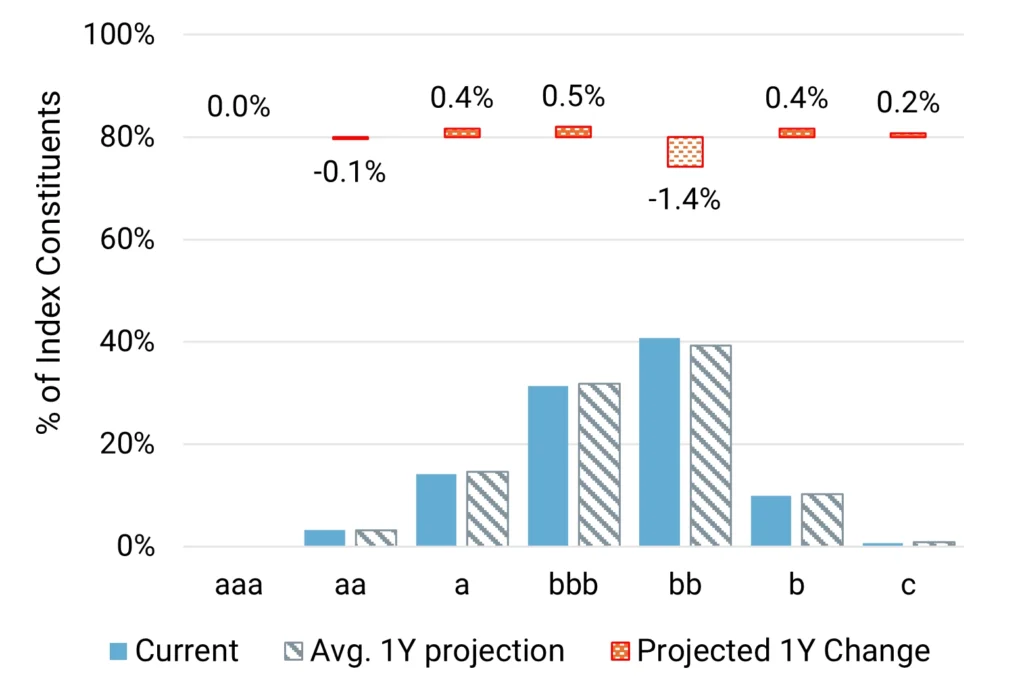
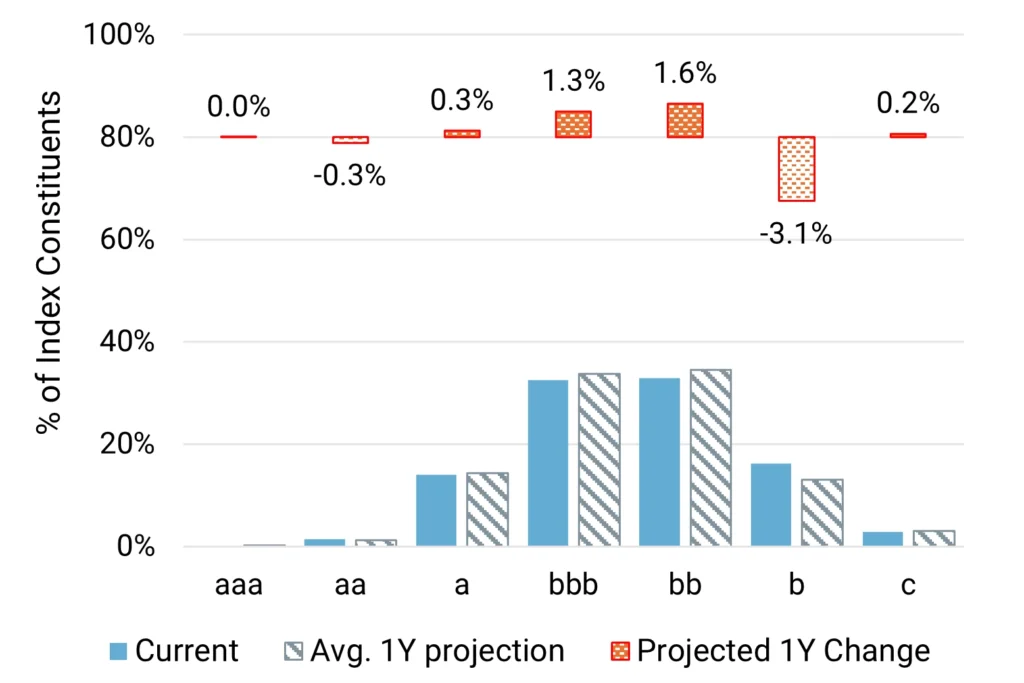
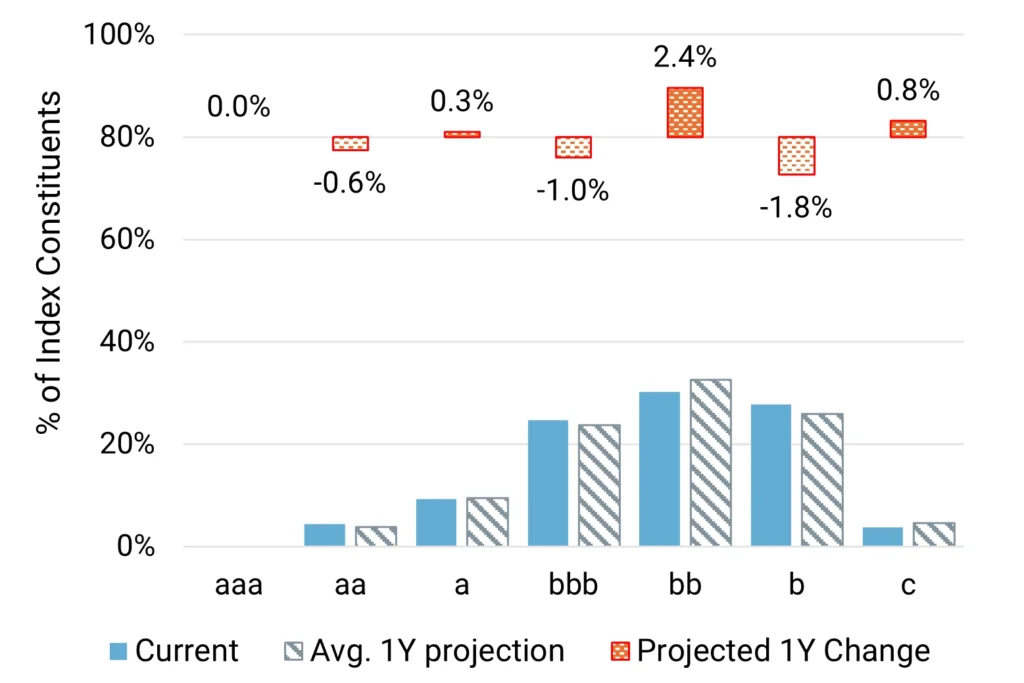
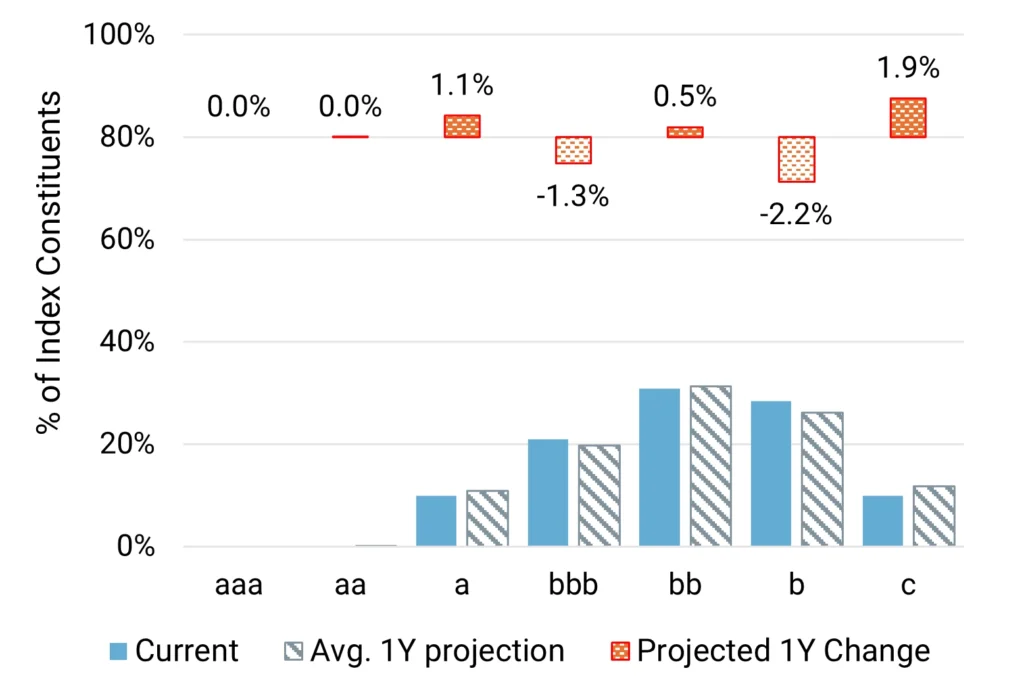
Projected change in credit distribution (%)
Key Takeaways
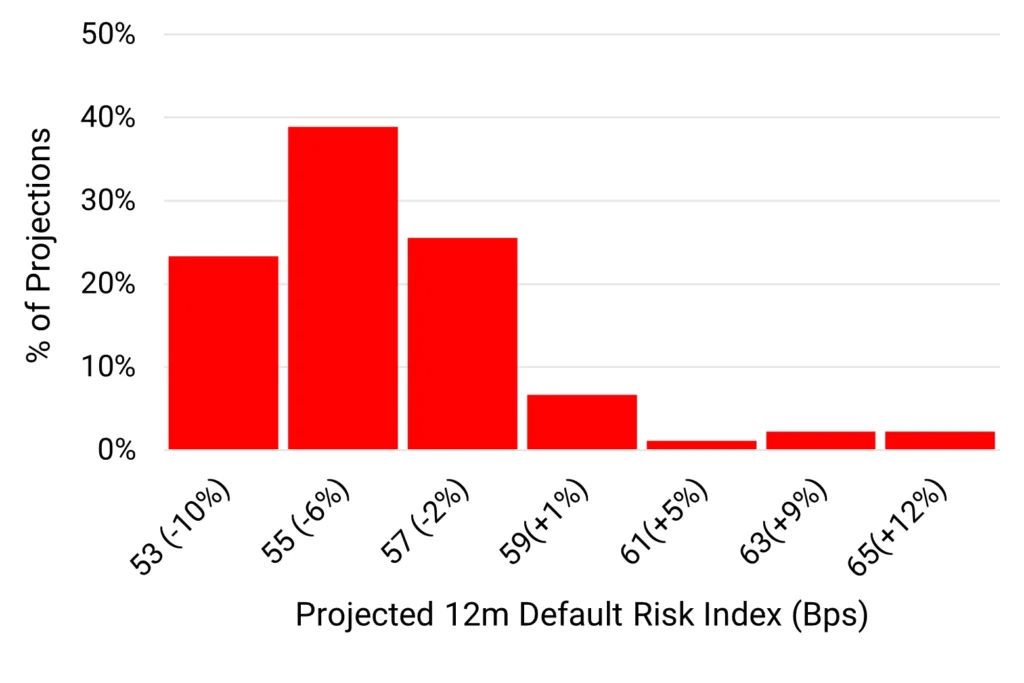
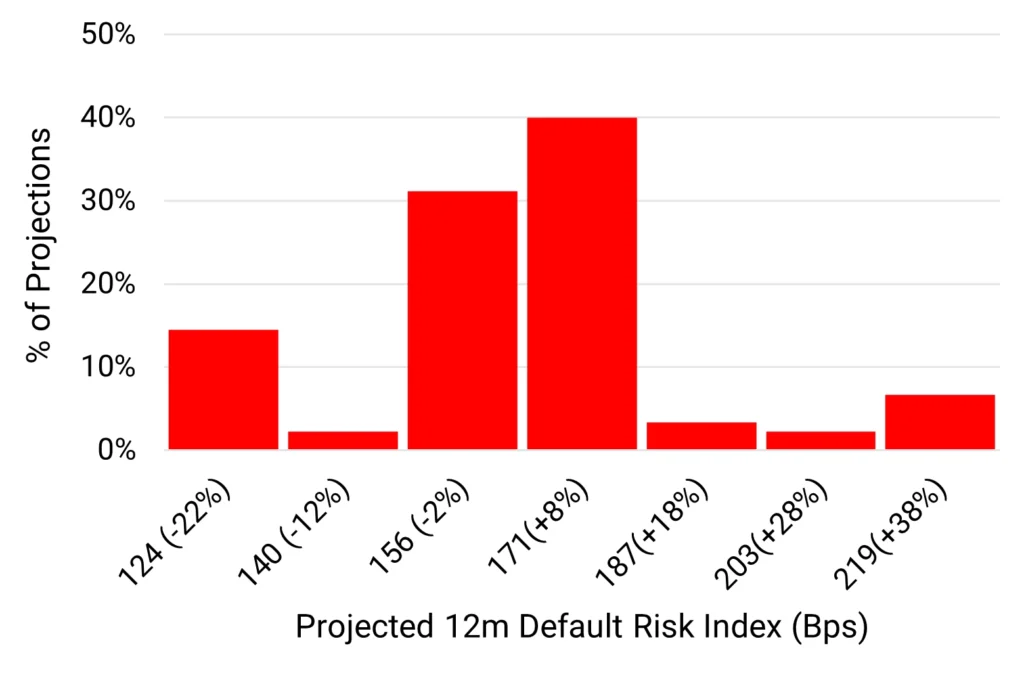
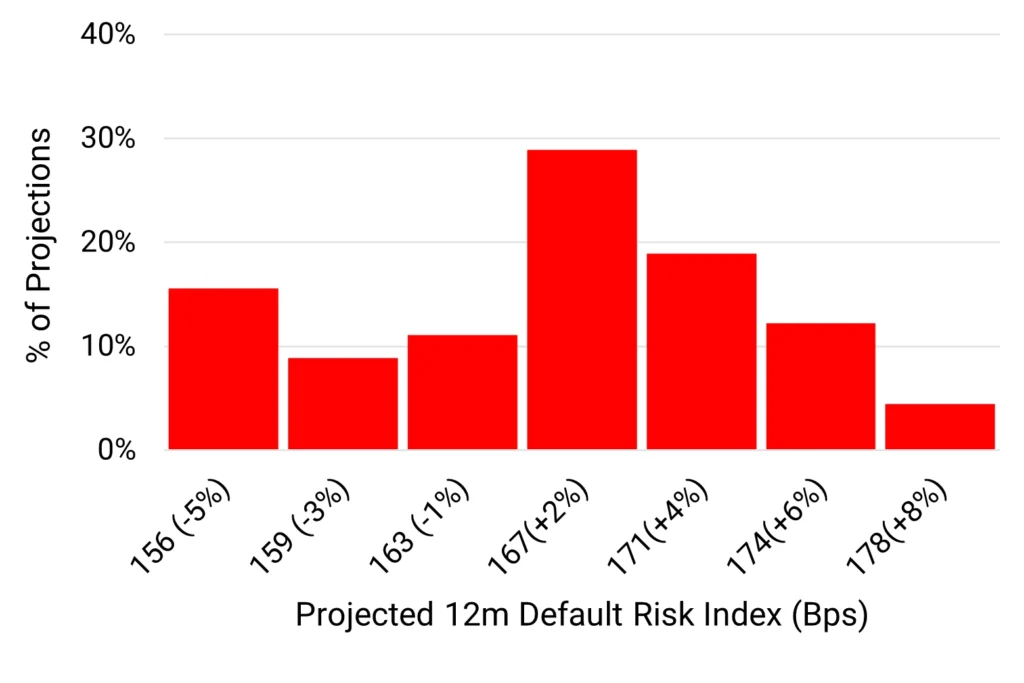
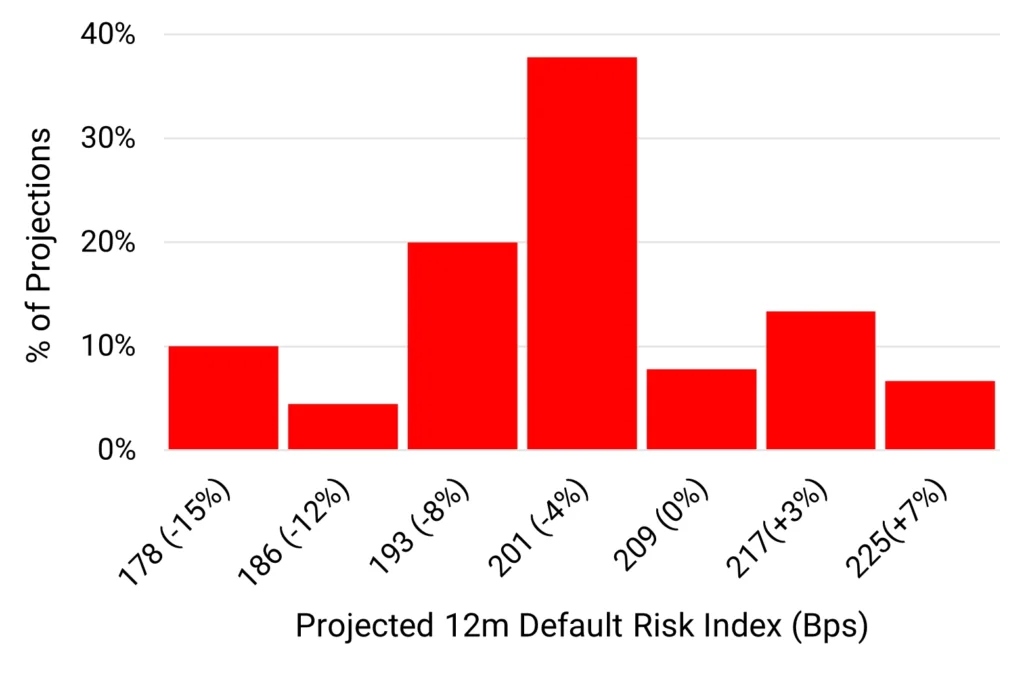
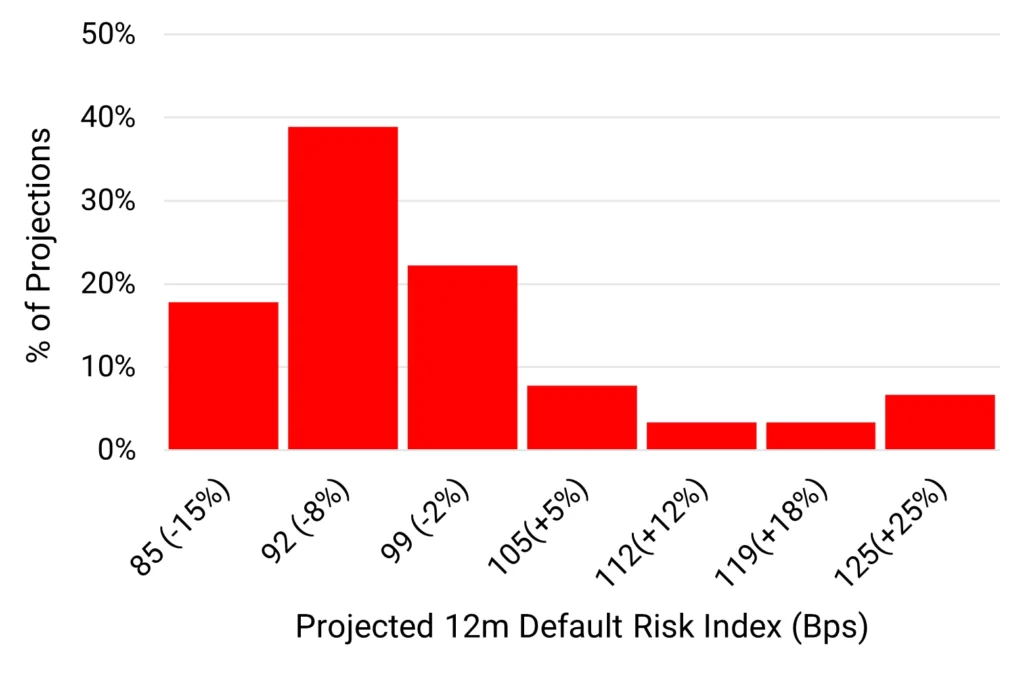
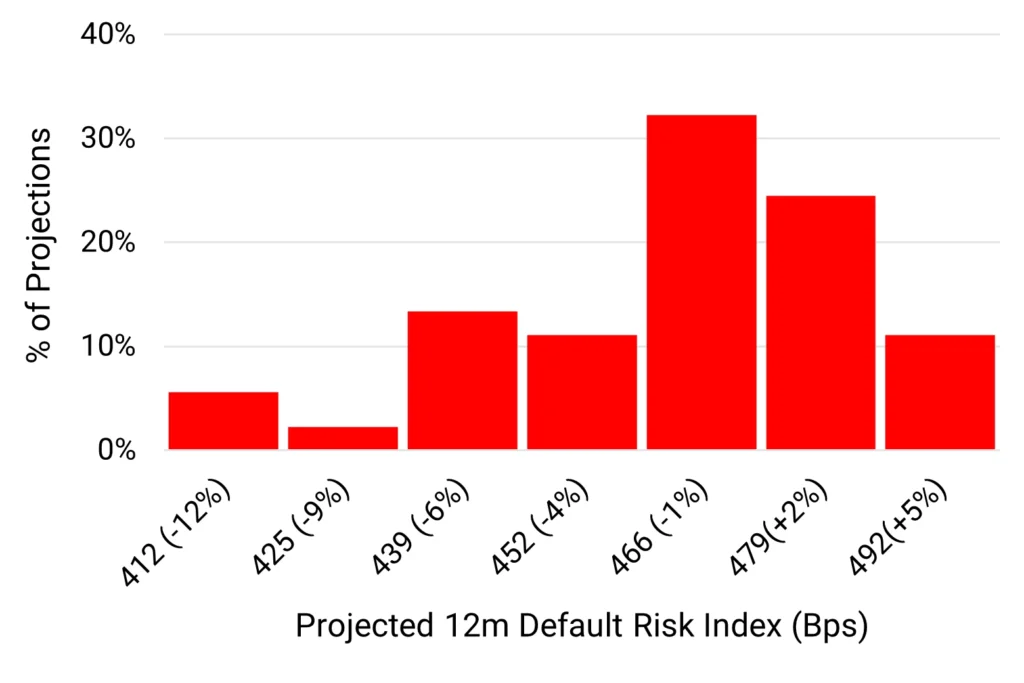
We predict US Corporate default risks^ to drop slightly (1%) over the next 12 months. There is a 20% chance that it is significantly lower (-11% or better) and a small (10%) chance of an increase of 7% or more.
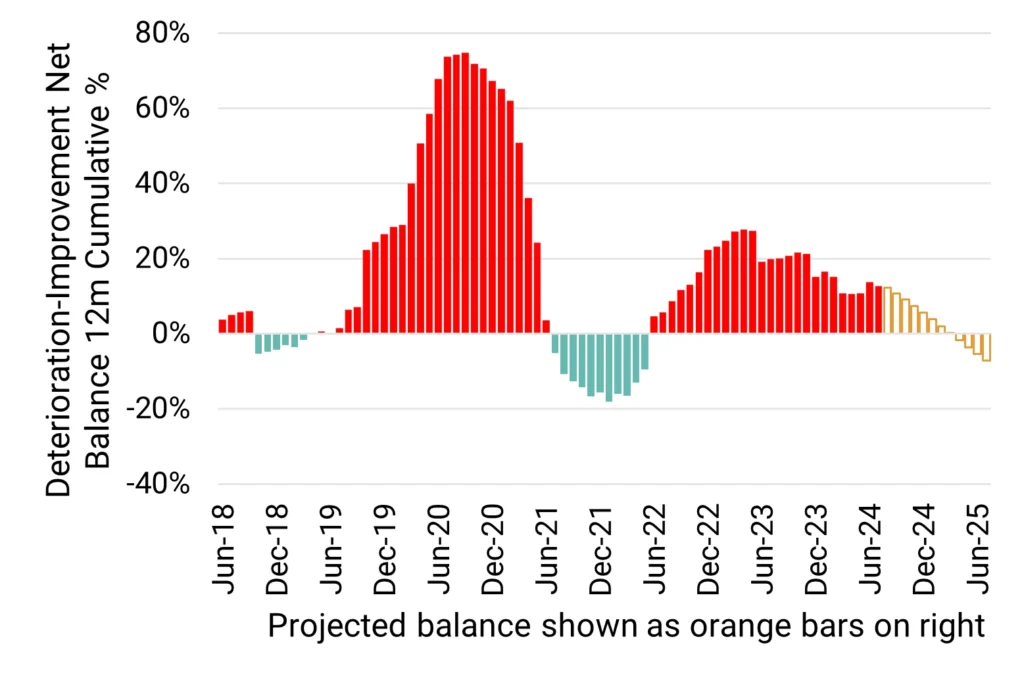
Deteriorations currently outnumber Improvements, so a H2 uptick in default rates is possible. But the balance is likely to move towards upgrades by Q1 2025.
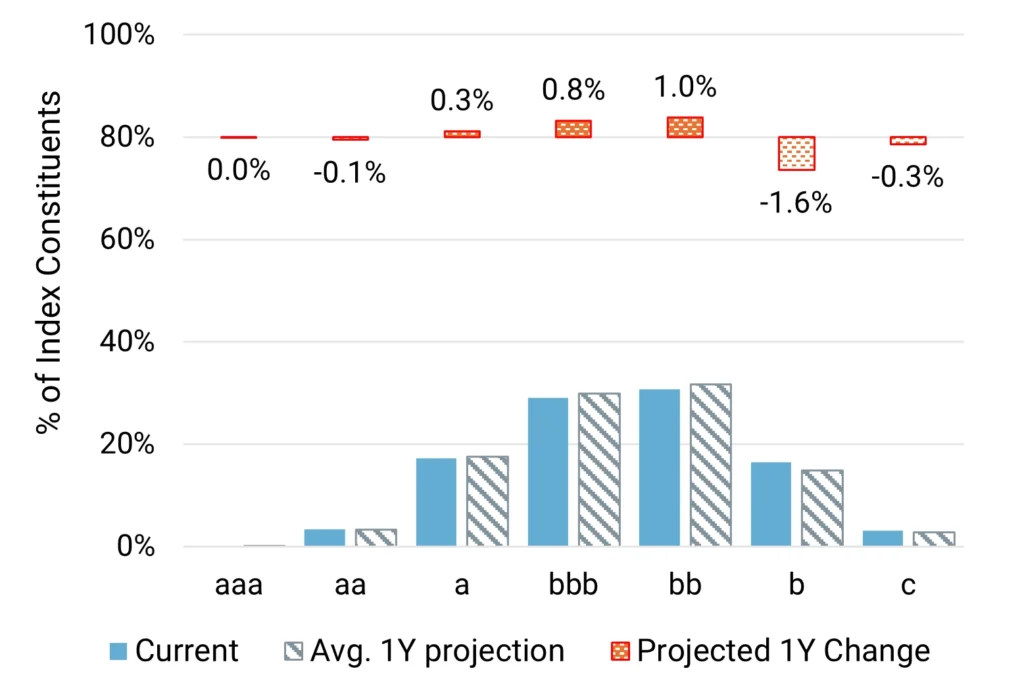
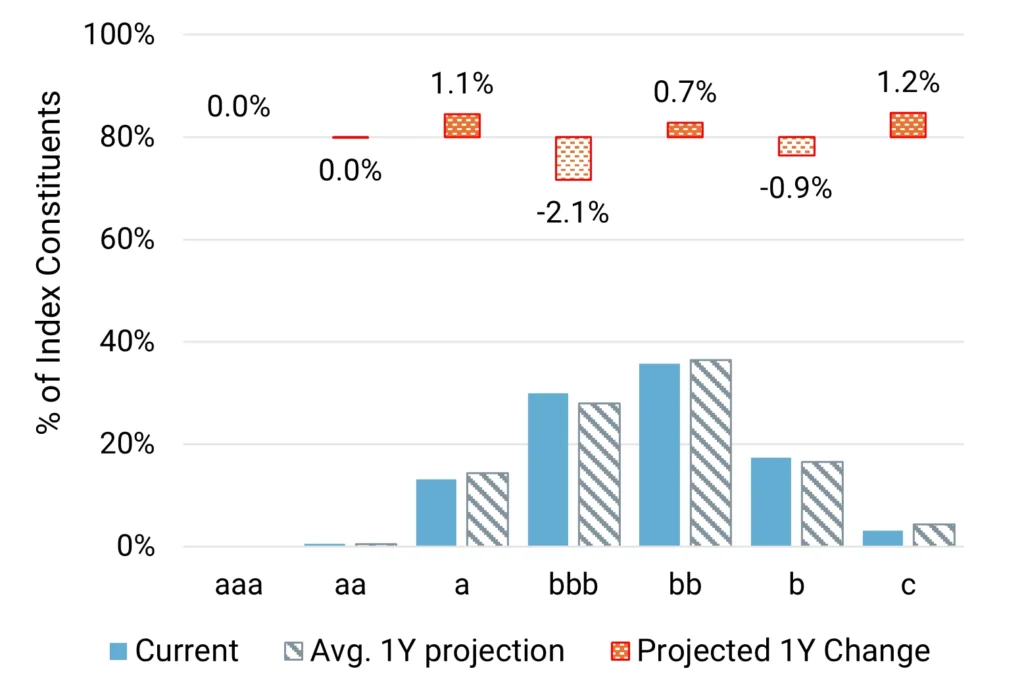
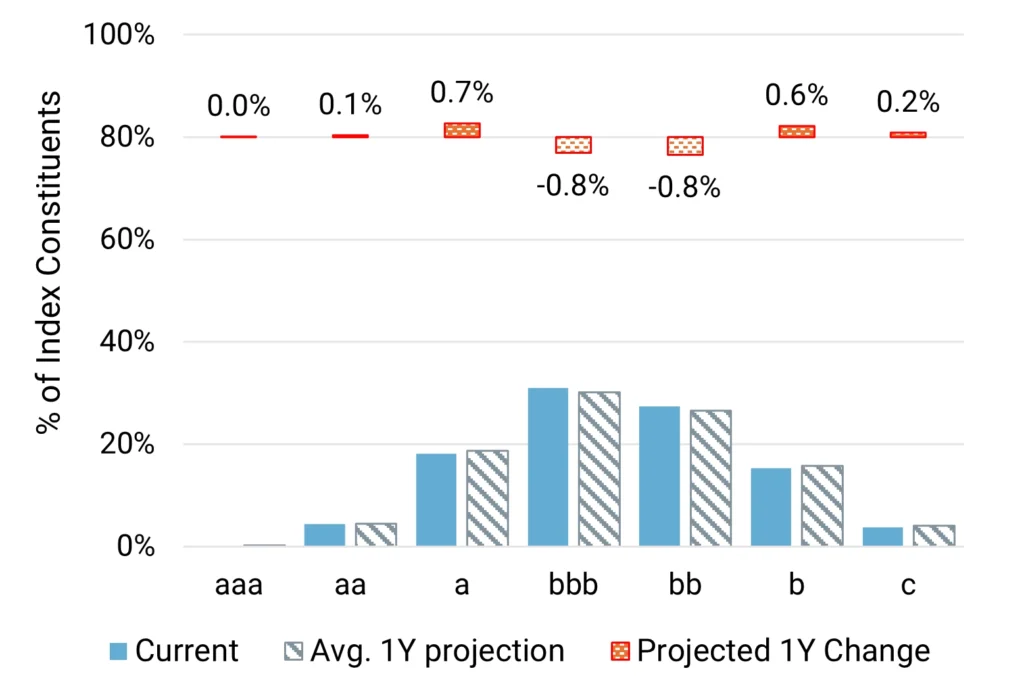
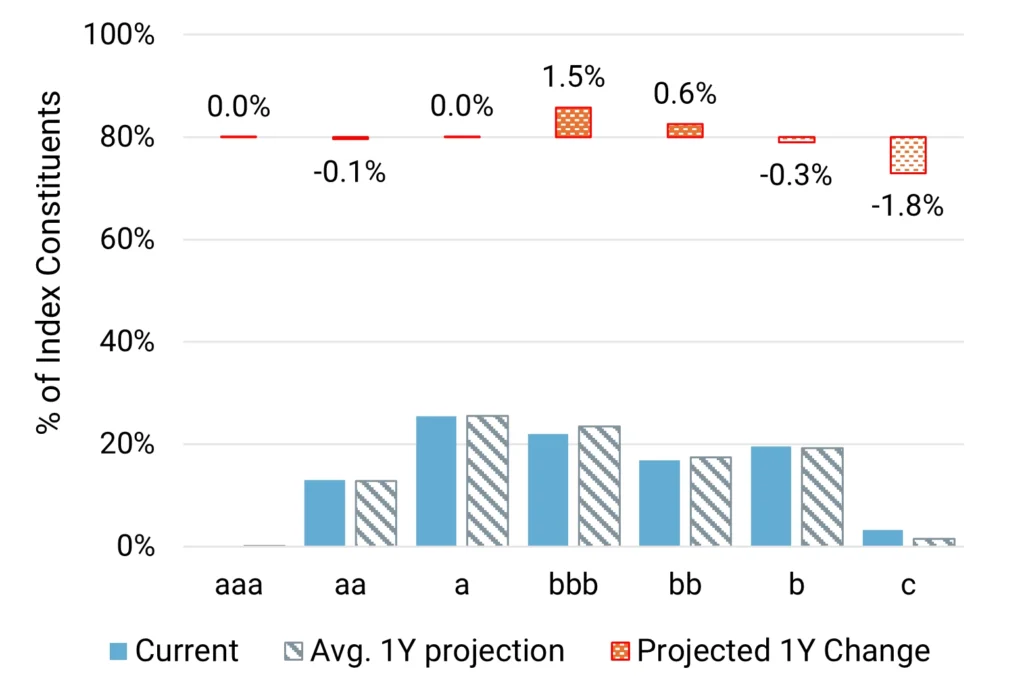
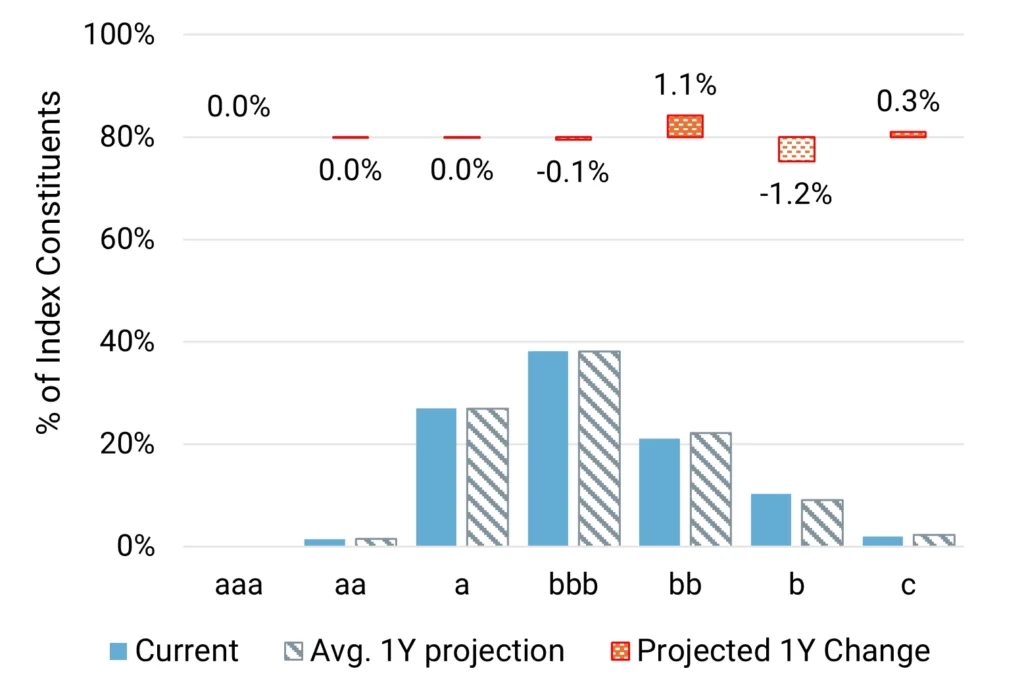
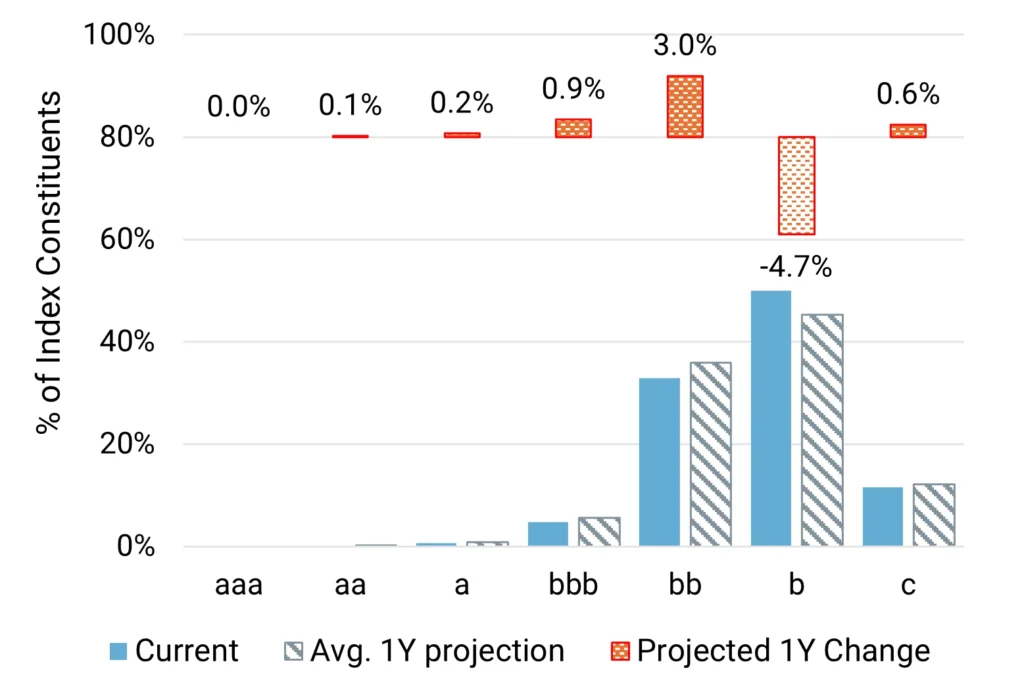
Credit migrations will be limited but we expect categories ‘bbb’ and ‘bb’ to increase, with ‘b’ decreasing.
The US Corporates universe covers 5251 obligors.
Historic 2-year trend: Improvement.
* Covering all corporate sectors, including those discussed in this report, but excluding financial institutions.
^ Default Risk is defined as a weighted average of S&P long-term observed default rates in each rating category, using the monthly sector credit breakdown as weights derived from contributed bank data.
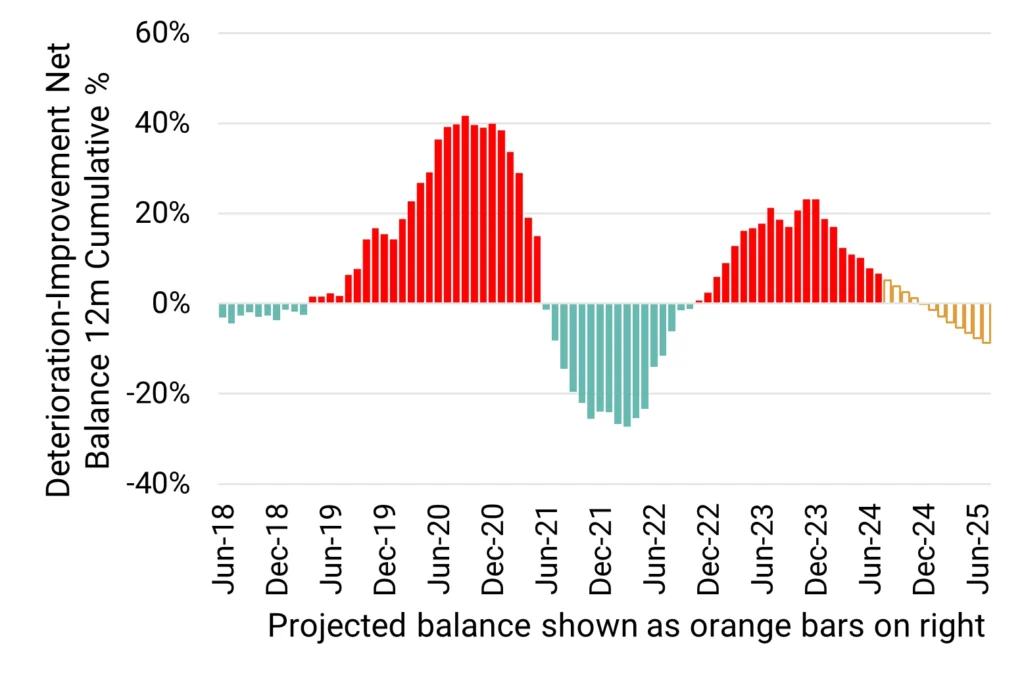
Outlook for US Financial Institutions
Default risks forecast to drop slightly as lower interest rates ease rollover pressure on heavily indebted corporates and mortgage borrowers. Volatile markets may hit major bank earnings but broader industry likely to benefit from higher loan volumes due to lower rates.
Projected 2025 default rate distribution
Deteriorations vs improvements % of total
12M PD change range 2018-2024
Projected change in credit distribution (%)
Key Takeaways
We predict US Financials default risks^ to decrease by 4% by mid-2025. There is a 20% chance of a larger drop (10% or more) and a very small chance (<10%) of an increase of 9%+.
Deteriorations outnumber Improvements; but the balance has plateaued and should turn towards Improvements by Q1 2025.
Credit migrations are projected to be minimal, with a very slight increase in the ‘bb’ and ‘b’ categories.
The US Financials universe covers more than 2515 obligors.
Historic 2-year trend: Improvement
^ Default Risk is defined as a weighted average of S&P long-term observed default rates in each rating category, using the monthly sector credit breakdown as weights derived from contributed bank data.
Outlook for US Oil & Gas
Default risks likely to rise if China growth falters and OPEC output stays high.
Projected 2025 default rate distribution
Deteriorations vs improvements % of total
12M PD change range 2018-2024
Projected change in credit distribution (%)
Key Takeaways
Our median prediction for the US Oil & Gas sector shows a modest increase (+12%) in default risk^ over the next 12 months. However, the outlook depends on demand from China (the world’s largest oil buyer) and OPEC production – both factors currently pointing to lower oil prices. There is a 60% chance of a moderate increase and a 10% chance of a major increase.
Deteriorations and Improvements are in balance, but we have factored in a step shift upwards, expecting deteriorations to persist over the next 12 months if China (and/or US) growth remains weak, with the added negative of an expansive OPEC policy.
Credit migrations are mixed. We expect the ‘bb’ category to shrink, with some downgrades to ‘b’ and ‘c’ but also small shifts to ‘bbb’ and ‘a’ categories.
The US Oil & Gas universe covers 440 obligors.
Historic 2-year trend: improving.
^ Default Risk is defined as a weighted average of S&P long-term observed default rates in each rating category, using the monthly sector credit breakdown as weights derived from contributed bank data.
Outlook for US Industrials*
Default rates show little change, aligned with US Corporates overall; projected range is narrow and symmetric.
Projected 2025 default rate distribution
Deteriorations vs improvements % of total
12M PD change range 2018-2024
Projected change in credit distribution (%)
Key Takeaways
We predict default^ rates for US Industrials to show no material change by mid-2025 – but some upward pressure over the next 6 months is likely. A modest drop of 5%-10% is more likely than a 5%-10% increase.
Deteriorations are currently above improvements (which could drive a short-term increase in default risks) but a shift to improvement is likely in H1 2025.
Credit migrations show a drop in the ‘b’ category by mid 2025. We expect the shift from here to be into ‘bb’ and ‘bbb’.
The US Industrials universe is large, covering 1312 obligors.
Historic 2-year trend: Improving.
* Covering the manufacture of industrial goods and services, e.g., constructions materials, aerospace, electronic equipment and components, defense equipment, railroads, marine transportation, industrial machinery, commercial vehicles and trucks, etc.
^ Default Risk is defined as a weighted average of S&P long-term observed default rates in each rating category, using the monthly sector credit breakdown as weights derived from contributed bank data.
Outlook for US Basic Materials*
Moderate increase (8%) in default risks expected by mid-2025 following major spike (+60%) in past 6 months. China/US growth continue to ease.
Projected 2025 default rate distribution
Deteriorations vs improvements % of total
12M PD change range 2018-2024
Projected change in credit distribution (%)
Key Takeaways
We predict US Basic Materials default^ rates to increase by 8% over the next 12 months. There is a 10% chance of a much larger move of close to +40%, after a huge (80%) spike in H1 2024. But there is a modest chance (15%) of a drop in the next 12 months if global growth rates hold up.
Deteriorations are high relative to Improvements but look to have plateaued. We expect a move towards improvement in H1 2025, but this may stall if global growth falters.
Credit migrations are mixed, but we expect a net shift towards non-Investment Grade. The main move is out of the ‘bbb’ category, with transitions to the ‘bb’ and ‘c’ categories as well as some upgrades to ‘a’.
The US Basic Materials universe covers 380 obligors.
Historic 2-year trend: Deteriorating.
* Covering the mining industries for aluminum, iron, steel, coal, gold platinum and precious metals, non-ferrous metals, as well as forestry and paper products.
^ Default Risk is defined as a weighted average of S&P long-term observed default rates in each rating category, using the monthly sector credit breakdown as weights derived from contributed bank data.
Outlook for US Consumer Goods
Consumer Goods show a slight increase in median default rates; but could spike moderately higher. Expected range is narrow compared with historic distribution.
Projected 2025 default rate distribution
Deteriorations vs improvements % of total
12M PD change range 2018-2024
Projected change in credit distribution (%)
Key Takeaways
We predict US Consumer Goods to show a small (2%) increase in default risk^ by mid-2025. There is a 15% chance of a decrease of 5% or more, but near 20% chance of an increase of 6% or more.
Deteriorations currently modestly outweigh Improvements but appear to be stabilising. Projections allow for the possibility of another spike up in Deteriorations but the scale of that is likely to be modest.
Credit migrations show small movement to the tails. The ‘bbb’ and ‘bb’ sectors are expected to shrink, with migrations to both lower HY and lower IG categories.
The US Consumer Goods universe covers 636 obligors.
Historic 2-year trend: Deterioration.
^ Default Risk is defined as a weighted average of S&P long-term observed default rates in each rating category, using the monthly sector credit breakdown as weights derived from contributed bank data.
Outlook for US Consumer Services
Consumer Services forecast to show slight drop in default risk by mid-2025 with modest chance of material improvement before year end. Projected range narrow compared with historic range.
Projected 2025 default rate distribution
Deteriorations vs improvements % of total
12M PD change range 2018-2024
Projected change in credit distribution (%)
Key Takeaways
We predict US Consumer Services to show a slight decline in default risk^. There is a 15% chance of a drop of more than 12%, against less than 10% chance of an increase of more than 7%.
Deteriorations and Improvements are currently close to balance. This is expected to move to a slightly improving balance by early 2025.
Credit migrations show a slight convergence to the centre of the distribution. The ‘b’ category is likely to be squeezed, mainly towards the ‘bbb’ and ‘bb’ categories, with some drop in the ‘a’ category as well.
The US Consumer Services universe covers about 876 obligors.
Historic 2-year trend: Stable.
^ Default Risk is defined as a weighted average of S&P long-term observed default rates in each rating category, using the monthly sector credit breakdown as weights derived from contributed bank data.
Outlook for US Technology
Uncertainty prevails: we expect moderate credit deterioration, as AI-driven capex risks short term overcapacity. But projected range is wide, close to or slightly exceeding historic norms.
Projected 2025 default rate distribution
Deteriorations vs improvements % of total
12M PD change range 2018-2024
Projected change in credit distribution (%)
Key Takeaways
We predict US Technology to post a modest increase (+10%) in median default risk^ by mid 2025, but the range of projections is very wide. There is a small likelihood of a material (33%) drop – which would be slightly larger than the largest historic decline. There is also a small chance (<10%) of a spike in default risk of more than 25%, and possibly more than 50% – close to historic highs.
Deteriorations vs. Improvements have dropped a lot in recent months. If current trends continue the sector will move towards an improving balance before the end of 2024, but volatility in the semiconductor market could reverse that.
Credit migrations show divergences. Projections show a shift out of the ‘bbb’ and ‘b’ categories, partly into ‘c’ but mainly into ‘bb’.
The US Technology universe covers 454 obligors.
Historic 2-year trend: Stable.
^ Default Risk is defined as a weighted average of S&P long-term observed default rates in each rating category, using the monthly sector credit breakdown as weights derived from contributed bank data.
Outlook for US Telecoms
Sector remains highly competitive and needs sustained investment; but some winners beginning to emerge which could stabilise default rates.
Projected 2025 default rate distribution
Deteriorations vs improvements % of total
12M PD change range 2018-2024
Projected change in credit distribution (%)
Key Takeaways
We predict US Telecoms to show another but more moderate increase (+14%) in default risks^, continuing its long-term decline. But the projected range is very wide and includes some scope (20%) for a very significant improvement.
Deteriorations continue to outnumber Improvements although the balance is well below its long term high. It is projected to move towards improvement in H1 2025 but there is a high risk that it remains in downgrade territory.
Credit migrations are again split between upgrades and downgrades, with another material increase in the ‘c’ category but a modest increase in the ‘a’ category.
The US Telecoms universe covers 81 obligors.
Historic 2-year trend: Deteriorating.
^ Default Risk is defined as a weighted average of S&P long-term observed default rates in each rating category, using the monthly sector credit breakdown as weights derived from contributed bank data.
Outlook for US Health Care
Election results are critical – deterioration looks most likely, but there is scope for substantial improvement in some scenarios.
Projected 2025 default rate distribution
Deteriorations vs improvements % of total
12M PD change range 2018-2024
Projected change in credit distribution (%)
Key Takeaways
We predict US Health Care to show a moderate 17% increase in in default risk^. Although an increase looks most likely, there is a small (10%) chance that mid-2025 default rates drop significantly from current levels
Deteriorations vs. Improvements are substantially skewed to deterioration – this is counterbalancing the sharp improvements that are beginning to appear in some projections. A broader move to Improvement is likely by mid 2025.
Credit migrations in the central case are skewed towards the ‘bbb’ category, mainly coming from the ‘c’ category. This is a positive signal for late 2025, since the ‘c’ category is critical to the default rate.
The US Health Care universe covers about 440 obligors.
Historic 2-year trend: Improving.
^ Default Risk is defined as a weighted average of S&P long-term observed default rates in each rating category, using the monthly sector credit breakdown as weights derived from contributed bank data.
Outlook for US REITs
Rate cuts are a major positive for the sector with default rates forecast to be broadly stable into 2025, but the Office sector remains challenging.
Projected 2025 default rate distribution
Deteriorations vs improvements % of total
12M PD change range 2018-2024
Projected change in credit distribution (%)
Key Takeaways
We predict US REITs to show a slight improvement in default risk^. There is an 80% chance that mid-2025 default rates drop from current levels, but a small (<10%) chance of a major (+25%) increase. Predicted range for default rates is much narrower than the long-term data.
Deteriorations vs. Improvements remain close to their pandemic peak, but a modest move to Improvement is likely by Q2 2025.
Credit migrations are minimal but skewed towards reductions in the ‘b’ category, mainly moving to the ‘bb’ category.
The US REITs universe covers about 204 obligors.
Historic 2-year trend: Improving.
^ Default Risk is defined as a weighted average of S&P long-term observed default rates in each rating category, using the monthly sector credit breakdown as weights derived from contributed bank data.
Outlook for US Leveraged Loans
Projections show continued decline, but pace has slowed. Projection range is very narrow by historic standards.
Projected 2025 default rate distribution
Deteriorations vs improvements % of total
12M PD change range 2018-2024
Projected change in credit distribution (%)
Key Takeaways
We predict US Leveraged Loans to show a very slight increase in default risk^. There is a near 10% chance that mid-2025 default rates drop by 9% or more, but a stronger chance of improvement by at least 5%.
Deteriorations vs. Improvements show an erratic but declining trajectory with modest move to Improvement likely by Q1 2025.
Credit migrations show a major shift out of the ‘b’ category. These are mainly moving to the ‘bb’ category, with small jumps in ‘c’ and ‘bbb’.
The US Leveraged Loan universe covers about 778 obligors.
Historic 2-year trend: Deterioration.
^ Default Risk is defined as a weighted average of S&P long-term observed default rates in each rating category, using the monthly sector credit breakdown as weights derived from contributed bank data.
Download PDF
Please complete your details to download the PDF of this report:
Projections are based on derived metrics from 1-Year ex ante Probability of Default (“PD”) estimates contributed by major global banks.
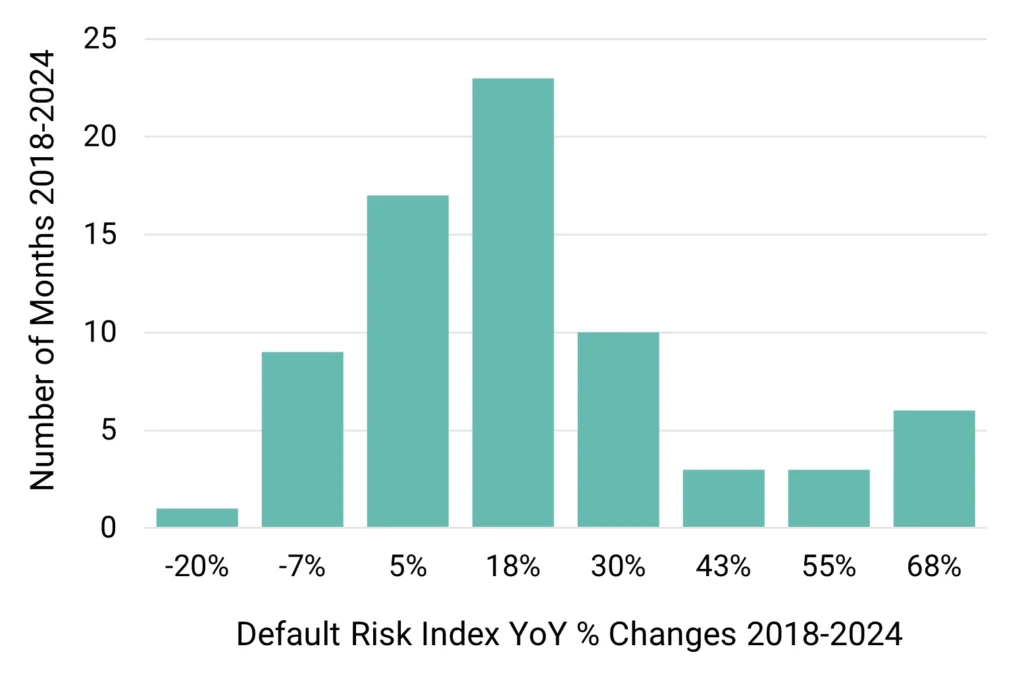
The reported “Default Rate” is a weighted average of the S&P long-term observed default rates for each of the seven main rating categories (from “aaa” to “c”). The monthly sector credit profile for each sector is estimated from contributed bank data and these are used as weights for the sector “Default Rate” calculation. This gives an index of default risk combined across investment-grade and high-yield borrowers. This index only changes when contributing banks amend the credit classification of borrowers. Changes in the index are therefore directly driven by the credit category transition rates. These are assumed to change with the credit cycle, measured by the 12-month rolling Deterioration-Improvement Net Balance (see below) which records ALL changes in PD estimates.
Projections are a mix of different methodologies, using multiple historical sample periods to capture short-, medium- and long-term trends:
Modelled default rates projected directly to end H1 2025, using time series projections for various lookback periods.
Rolling 12m net balance of deteriorations vs improvements (“DIN”) across all credit categories in each sector, projected to the end of H1 2025. This is used to weight peak and trough transition matrices as a function of the sector credit cycle phase.
Proportion of sector borrowers projected to be in each credit category by H1 2025, with added weight for the “c” category. The majority of defaulting borrowers will transition from this category. This approach uses a blend of direct projection and projected transition matrices.
All projection types use multiple historic periods to give a range of future possible outcomes. Many of these give similar results, but some project large outliers in either tail of the distribution.
Reported ranges cover the 10th to 90th percentiles, and the central case is based on the 50th percentile.