
About this report
Credit Benchmark’s UK Default Risk Outlook draws on an extensive database of over 105,000 unique Consensus Credit Ratings (CCRs). These Consensus Credit Ratings represent the internal risk views of expert analysts at the world’s leading banks – a previously untapped source of risk intelligence. 90% of the entities with Consensus Credit Ratings are not rated by a major credit rating agency, meaning these projections offer a new and significant capacity for analysing default risk.
Although this report focuses on UK Industries, the methodology can be applied to the broad and highly representative dataset of 105,000+ Consensus Credit Ratings (see here for Default Risk Outlook on US Industries and here for EU Industries). The probability of default projections can be customized for our clients to match their own classification schemas and align more accurately with their portfolios and exposures.
Vigilant risk management is vital when navigating an unpredictable economic climate. With broader, deeper, and more frequent analytics than previously available, Credit Benchmark is now able to offer the market a comprehensive and differentiated view on default risks.
If you would like a free and fully confidential analysis of the default risk projections of your own portfolio, we encourage you to get in touch here.
Table of Contents
Overview: UK Macro Risk Landscape
Credit default risk for UK companies is expected to plateau by mid-2025. The UK’s new Labour administration faces tight fiscal limits, but it has so far passed the currency and bond market credibility test. Andy Haldane of the FT expects an influx of international capital, responding to political uncertainty in the US and EU. Former Governor of the Bank of England Mark Carney has outlined a revised public-private partnership model under Labour’s National Wealth Fund, proposing a 25% Public / 75% Private funding split. Part of this is intended to bring long term investors (pension funds and insurance companies) into national infrastructure projects. Reform of planning laws will aim to tackle the chronic UK housing shortage which is good volume news for housebuilders, but margins may be thinner. With no quick fix for the NHS – other than pay rises – current broader Health Care sector trends are likely to continue.
The credit impact of these changes will take time to unfold. Some sectors – Railways and the Utilities – face major restructuring, with possible public ownership, and these are excluded from this report. More broadly, the new administration sees a need for sustained private sector investment; aiming for positive long-term results at the cost of short-term balance sheet strains.
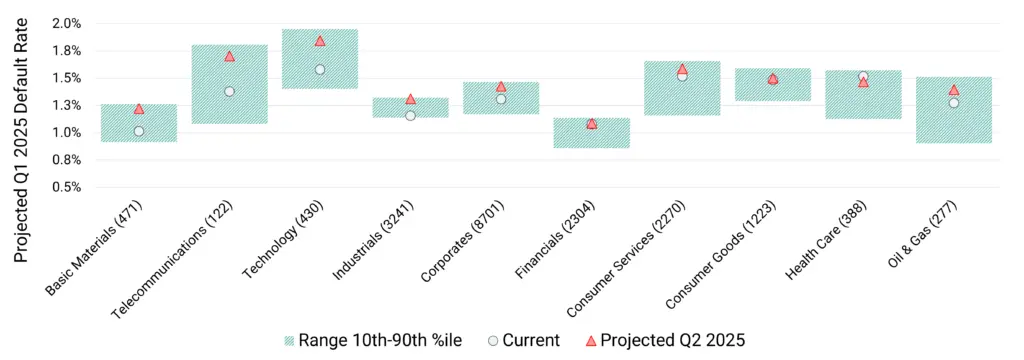
Without significantly lower interest rates coming into play, the 1-year credit outlook still forecasts a modest increase in UK Corporate default rates. Current projections show that default risk will decrease for only 18% of the 134 UK sectors tracked by Credit Benchmark in the next 12 months. This report highlights that the most vulnerable industries are those with global drivers: Basic Materials, Technology, and Telecoms. The major domestic groupings – Corporates, Industrials and Financials – show modest deterioration, while Consumer, Healthcare and Oil & Gas sectors show little change. The final section of this report lists the top 10 improving and deteriorating sectors; detailed analysis for these is available on request.
2024/25 UK Default Risk Forecast
Default risks to plateau over next 12 months; any rate cuts will have limited short-term impact, but positive medium-term outlook if bond and currency markets remain stable, and proposed public-private investment boom gathers momentum.
Credit Benchmark’s projected default rate for Q1 2025
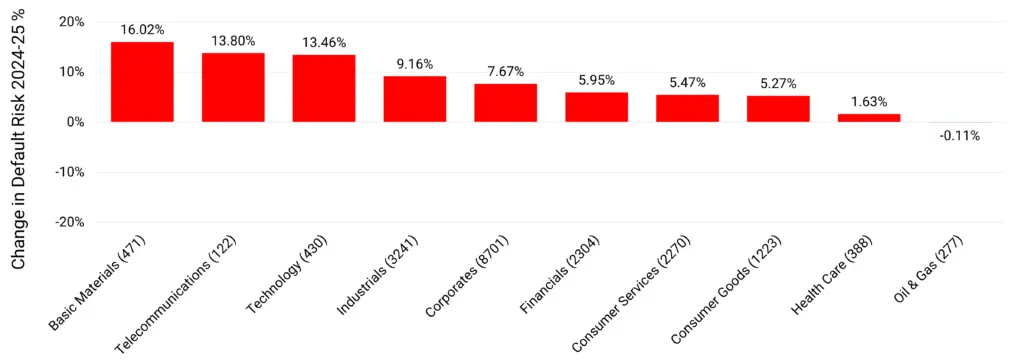
Change (%) in the probability of default (PD) during 2024/25
Key Takeaways
- We predict UK default^ risks to drift higher during H2 2024, plateauing in H1 2025 as growth picks up. But higher inflation or any post-election FX volatility could delay BoE rate cuts.
- Basic Materials, Telecoms and Technology are expected to show higher (>10% increase) default rates by Q2 2025.
- Industrials, Corporates, Financials and Consumer Industries are forecast to post moderately higher (5% to 10% increases).
- Health Care and Oil & Gas are expected to show no material change.
- The range of possible UK default rates is wide and the larger industry projections are skewed to the lower end. This leaves some scope for surprise post-election credit upgrades.
^ Default Risk is defined as a weighted average of S&P long-term observed default rates in each rating category, using the monthly sector credit breakdown as weights derived from contributed bank data.
Outlook for UK Non-Financial Corporates*
Labour policies likely to favour growth but may heighten inflation risks. Default risks to rise in H2 2024 but stabilise by mid-2025.
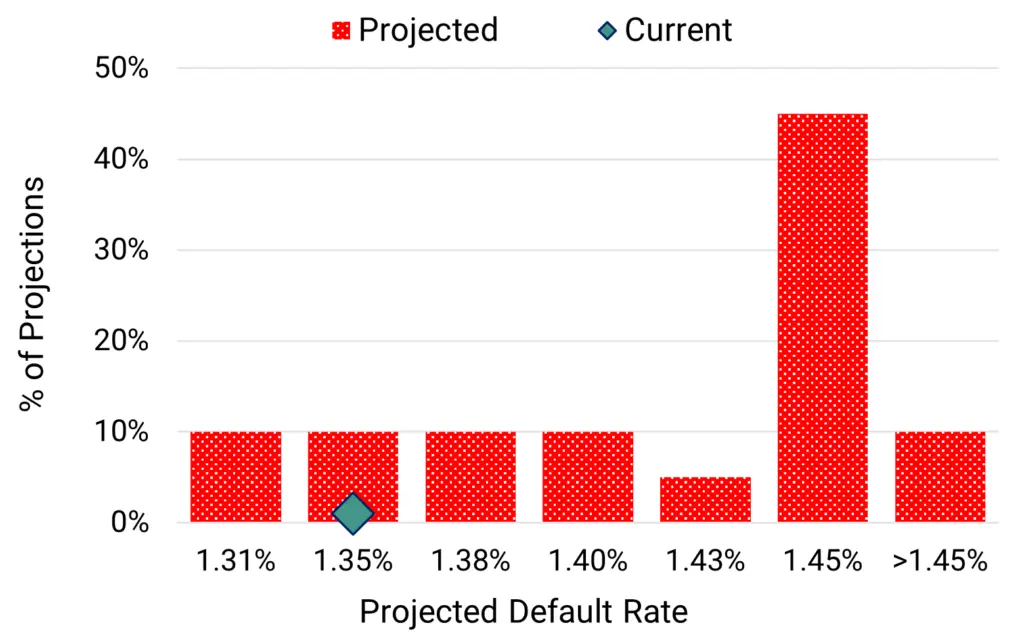
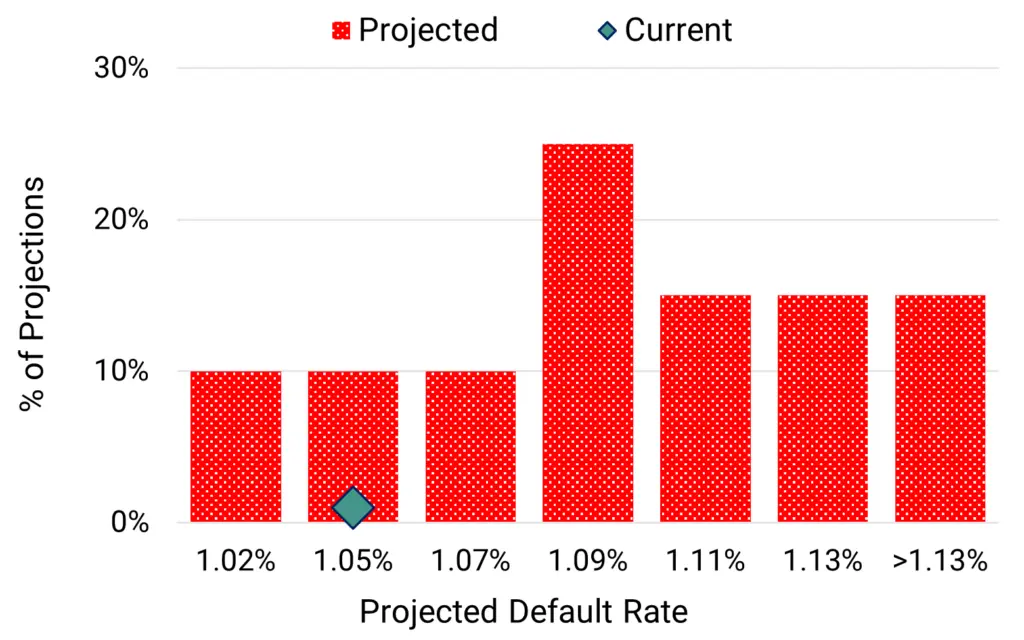
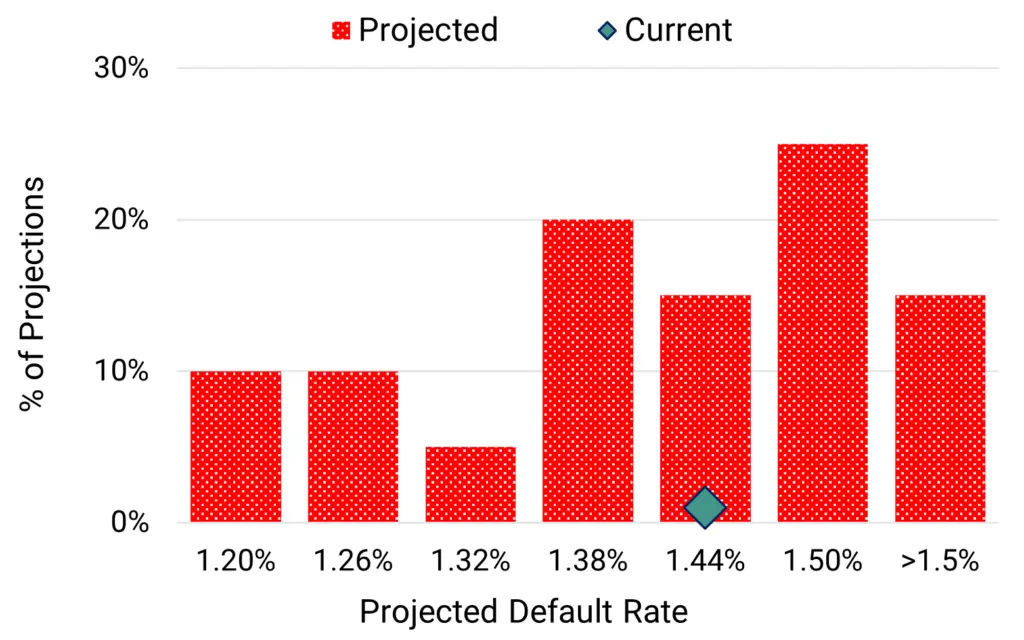
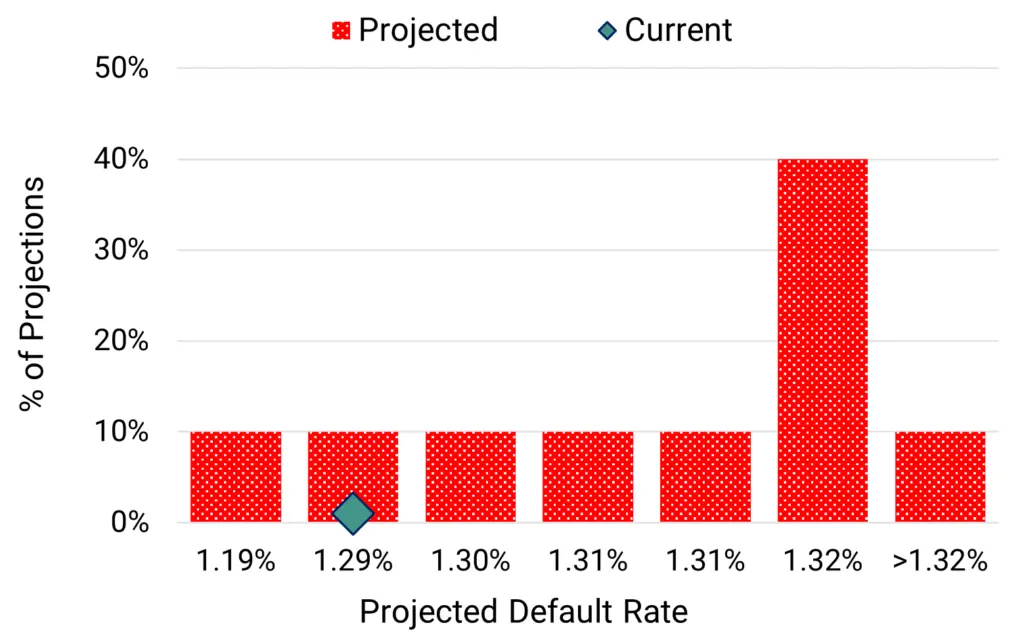
Projected 2024 default rate distribution
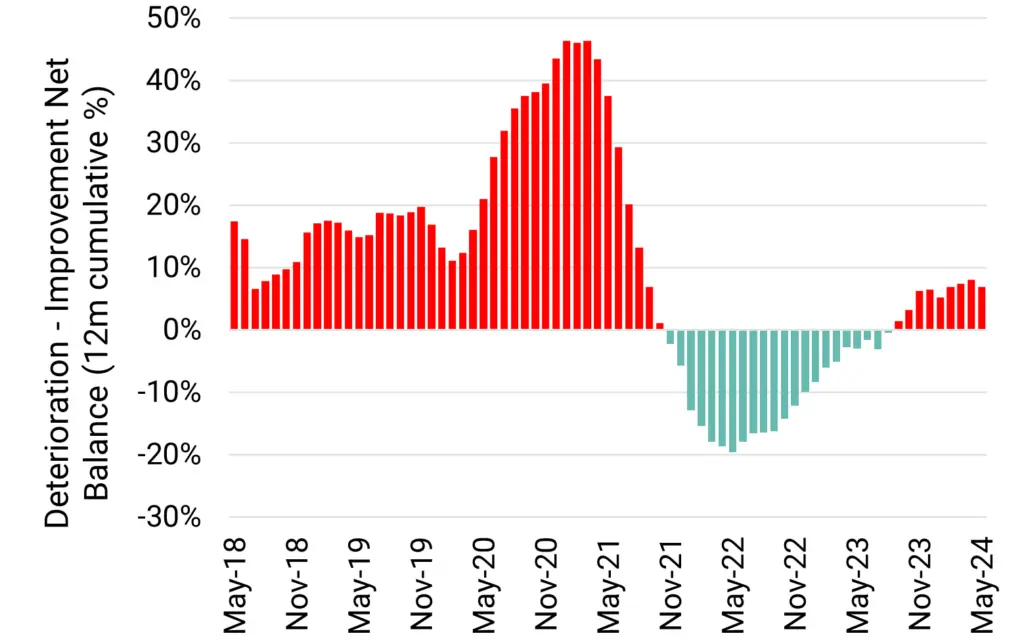
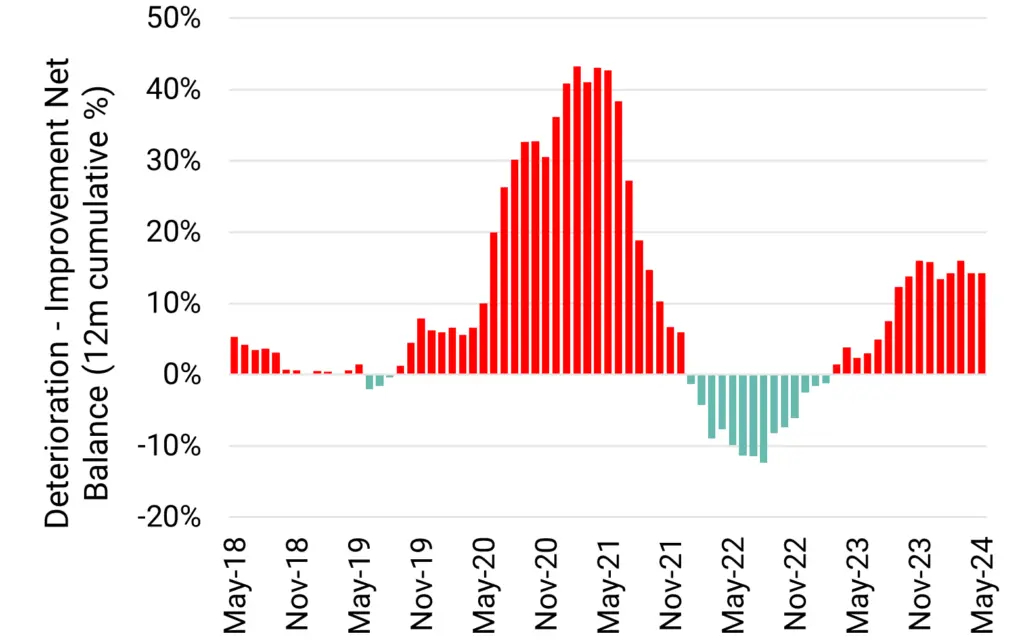
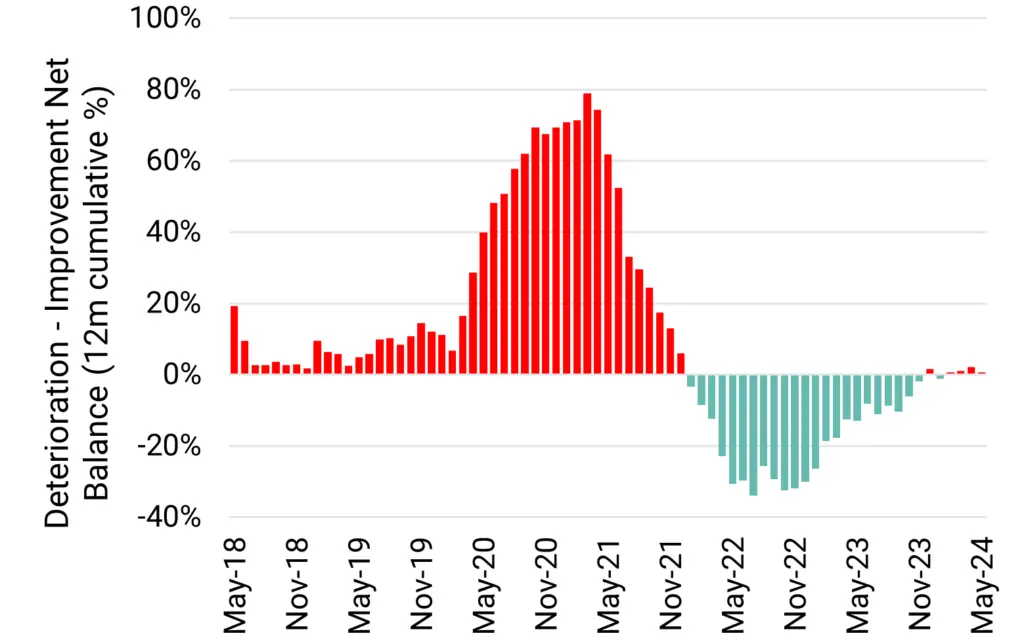
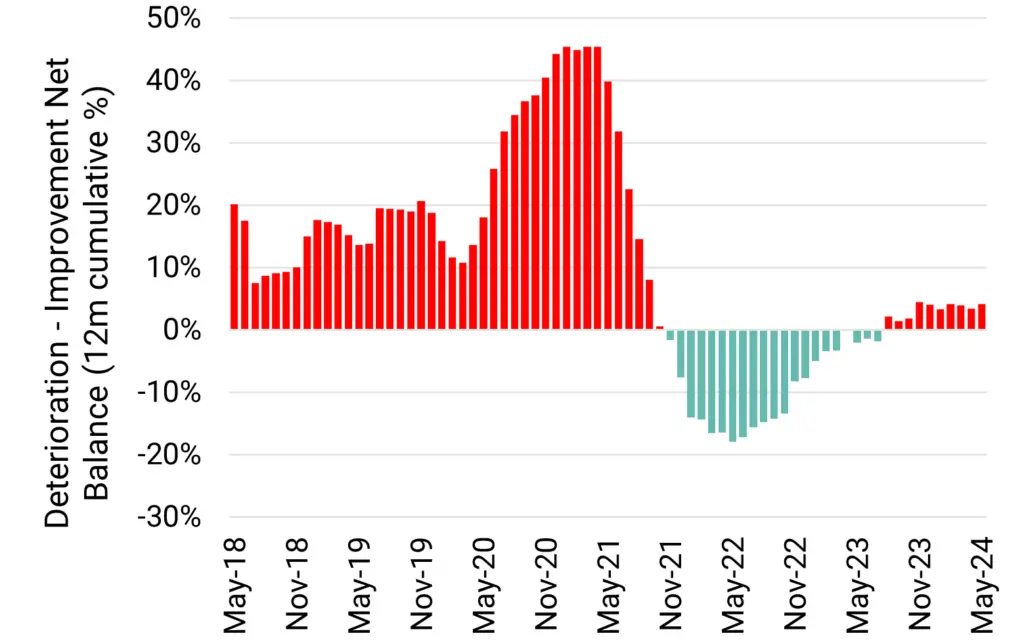
Deteriorations vs improvements % of total
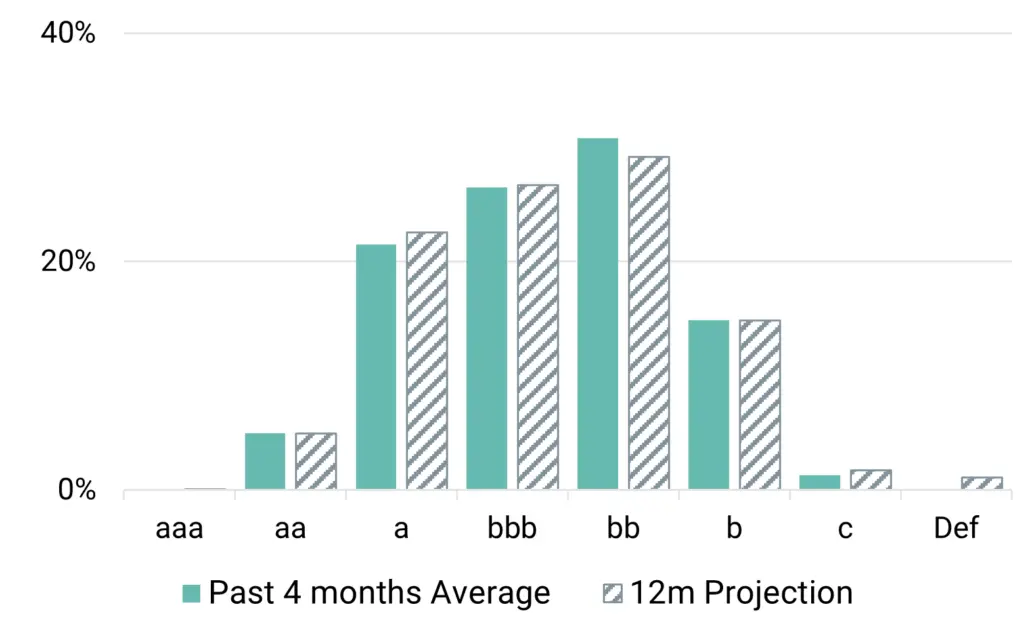
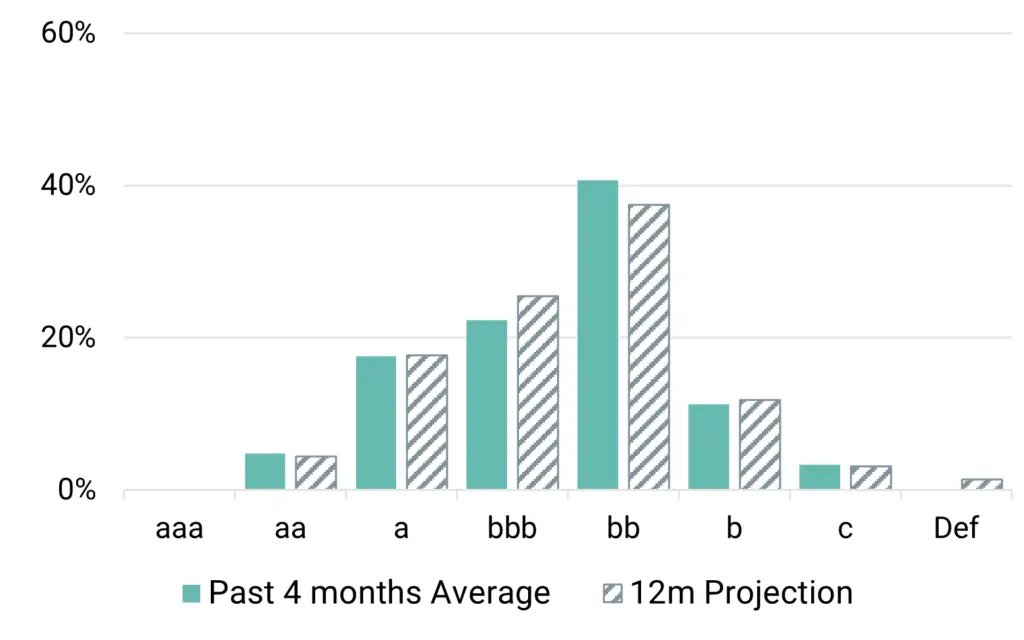
Distribution by rating category (%)
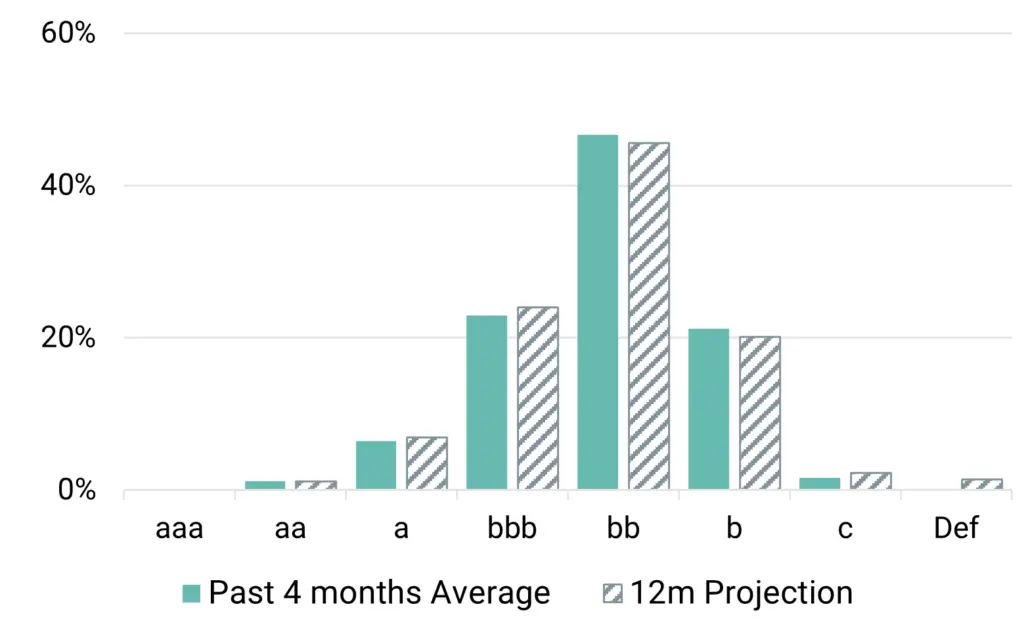
Distribution by rating category (%)
Key Takeaways
- We predict UK Corporate default^ risks to rise by about 8% over the next 12 months. There is a 10% chance that it is lower, but more than 50% of projections show a material increase.
- Deteriorations currently outnumber Improvements, but the balance is likely to peak before mid-2025, clearing the way for upgrades in H2 2025. NB: IF the UK Corporates credit cycle turns positive earlier – e.g. due to lower rates and / or an investment boom – then expect to see other industries also swinging towards Improvement.
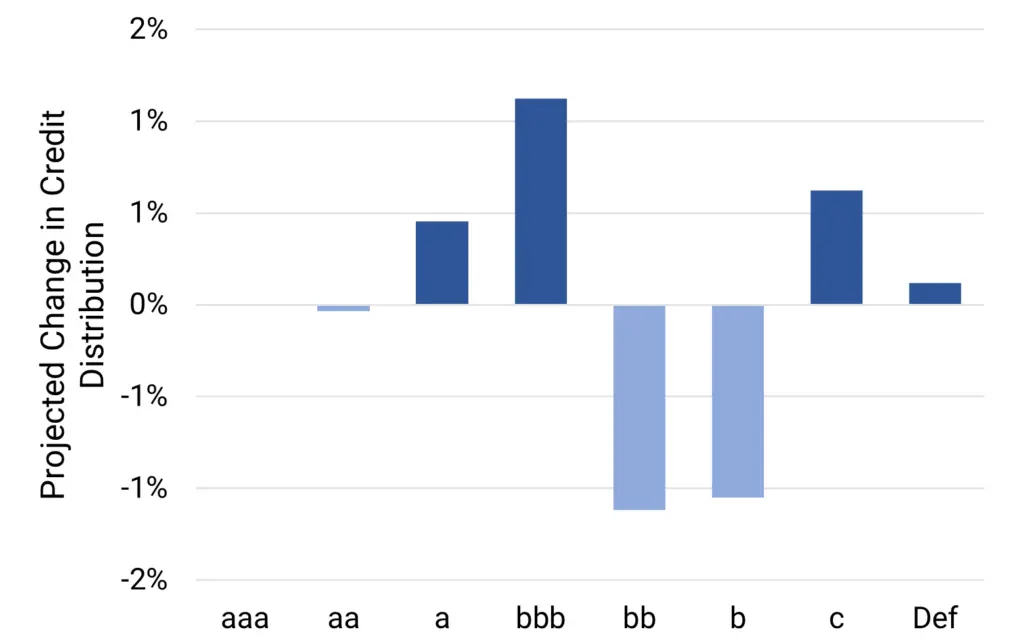
- Credit migrations will be limited but we expect categories ‘bbb’ and ‘c’ to increase, with ‘bb’ and ‘b’ decreasing. The ‘a’ category is also likely to increase.
- Credit Benchmark covers 8,701 UK non-financial Corporate obligors, 98% of which are not rated by a credit rating agency.
- Historic 2-year trend: Improvement.
* Covering all corporate sectors, including those discussed in this report, but excluding financial institutions.
^ Default Risk is defined as a weighted average of S&P long-term observed default rates in each rating category, using the monthly sector credit breakdown as weights derived from contributed bank data.
Outlook for UK Financial Institutions
Default risks set to rise as heavily indebted borrowers face rollover challenges; backdrop of global regulatory change, possible rate cuts and UK investment boom should limit any deterioration.
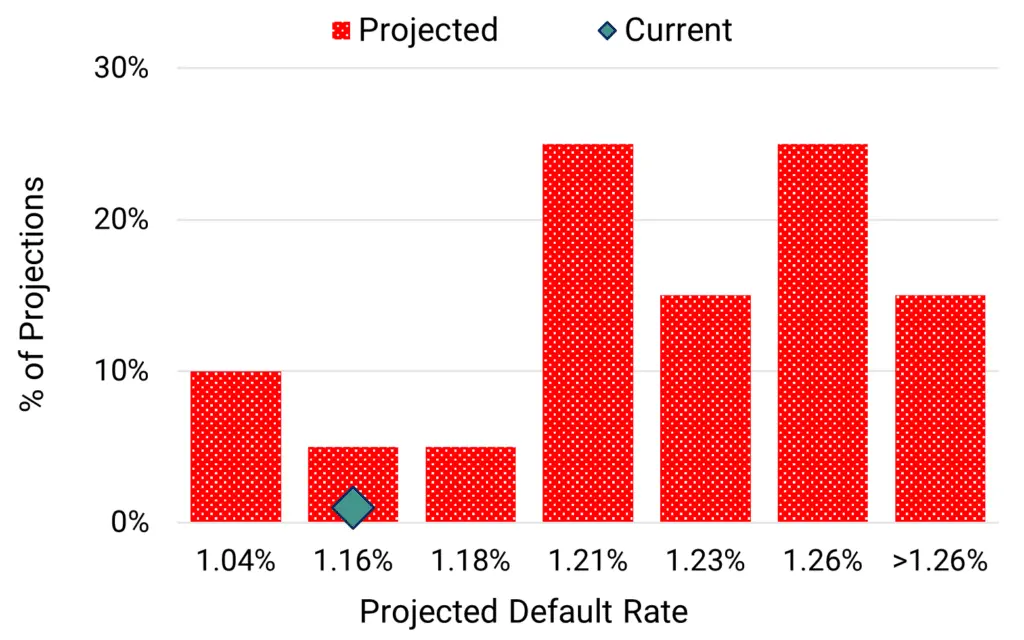
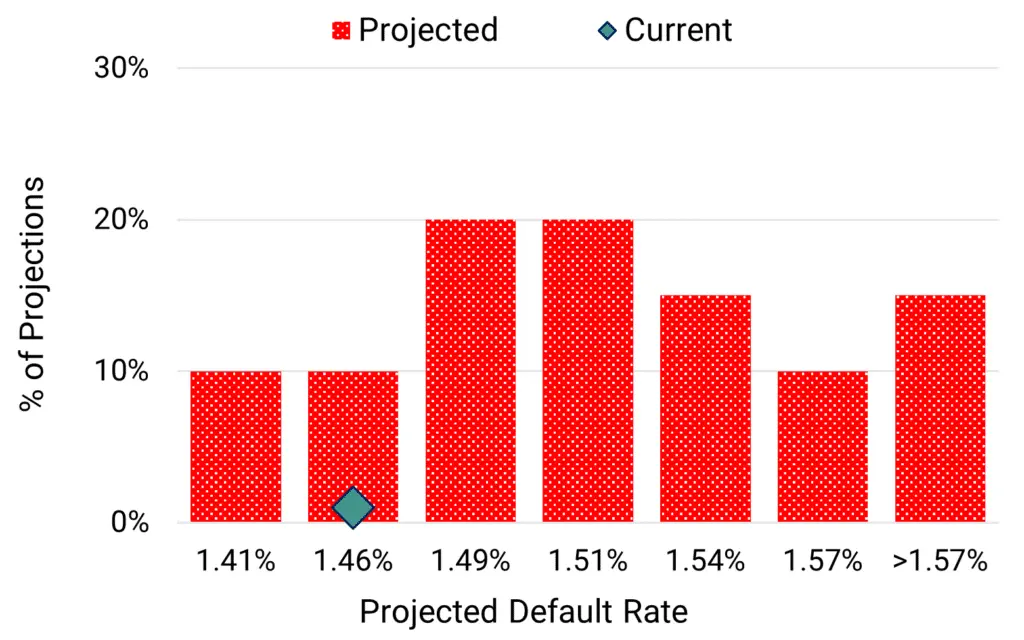
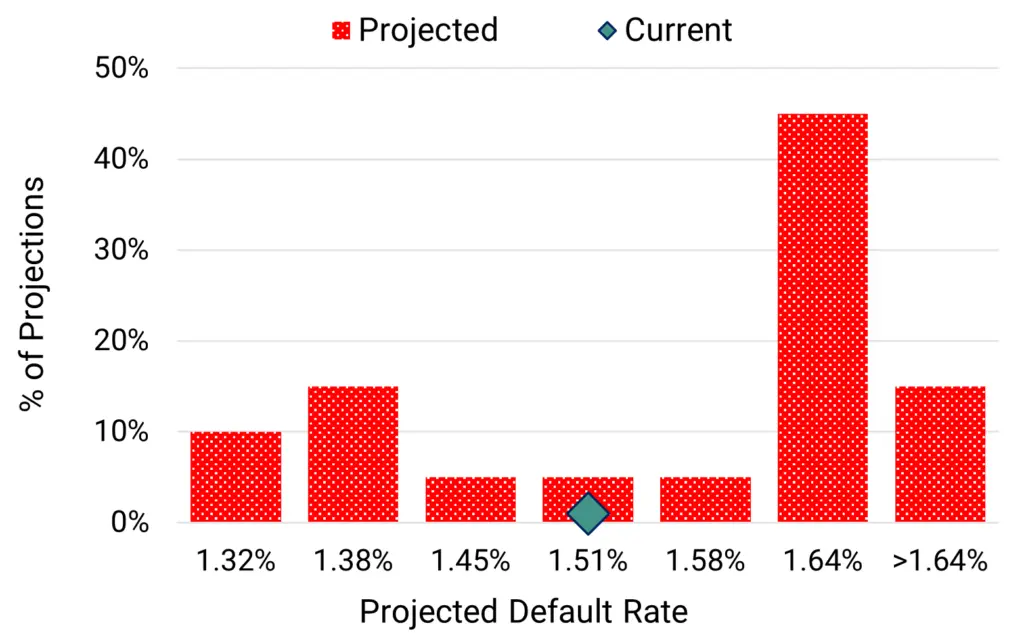
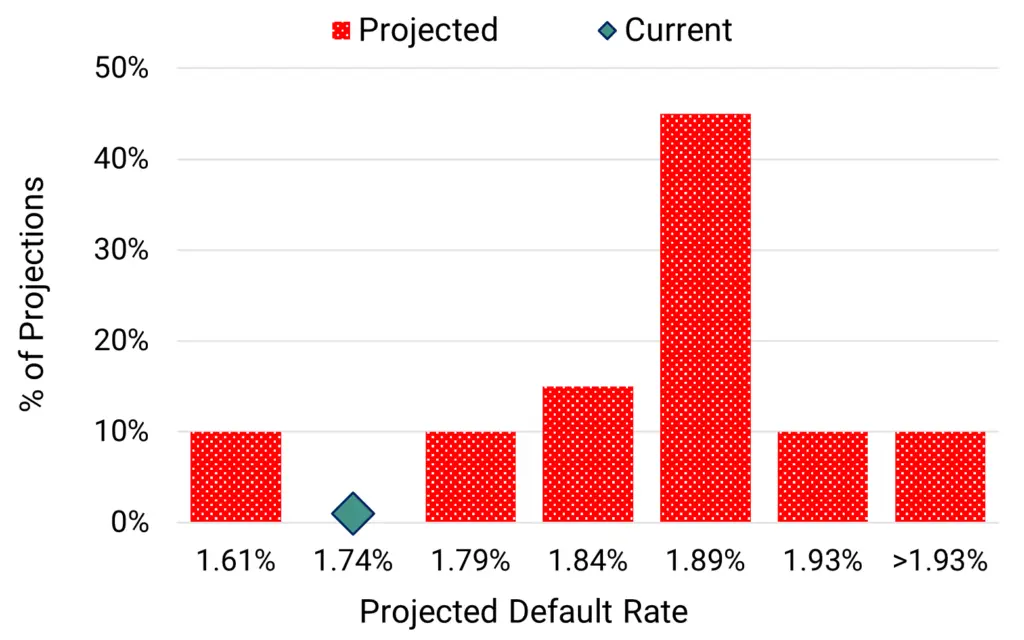
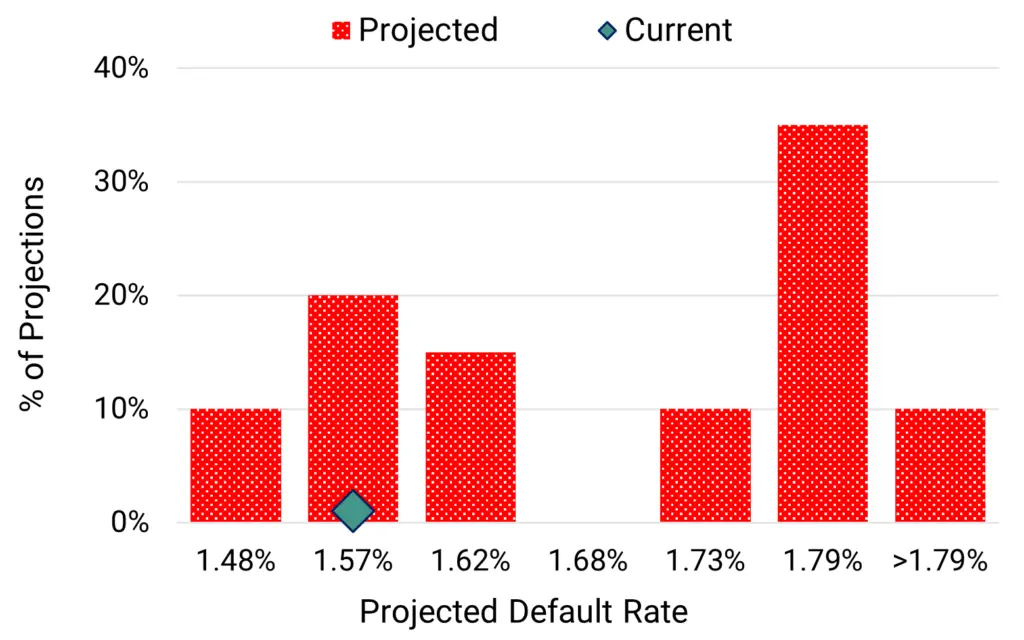
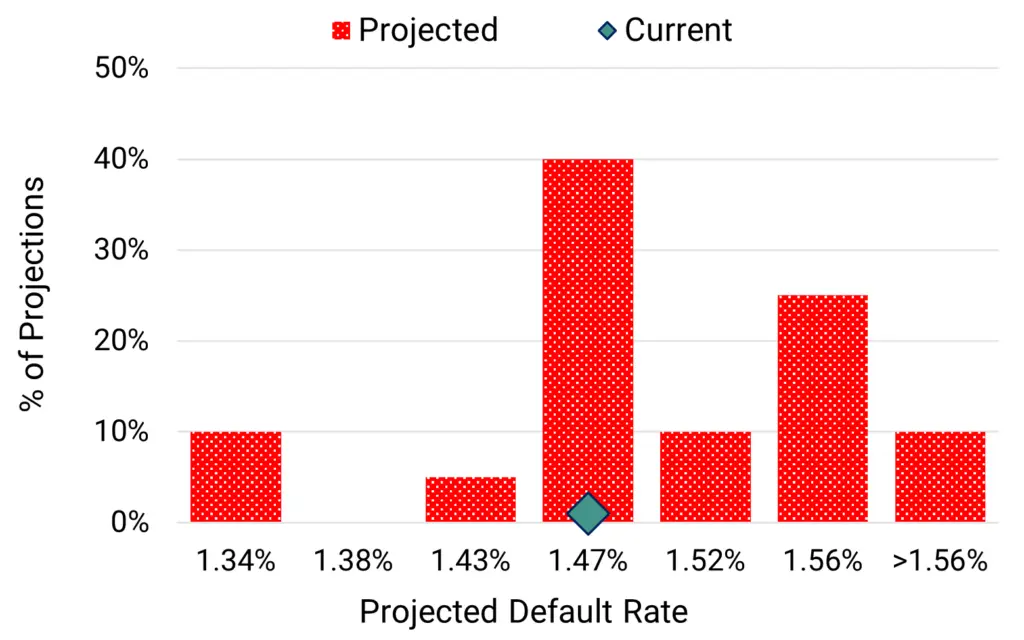
Projected 2024 default rate distribution
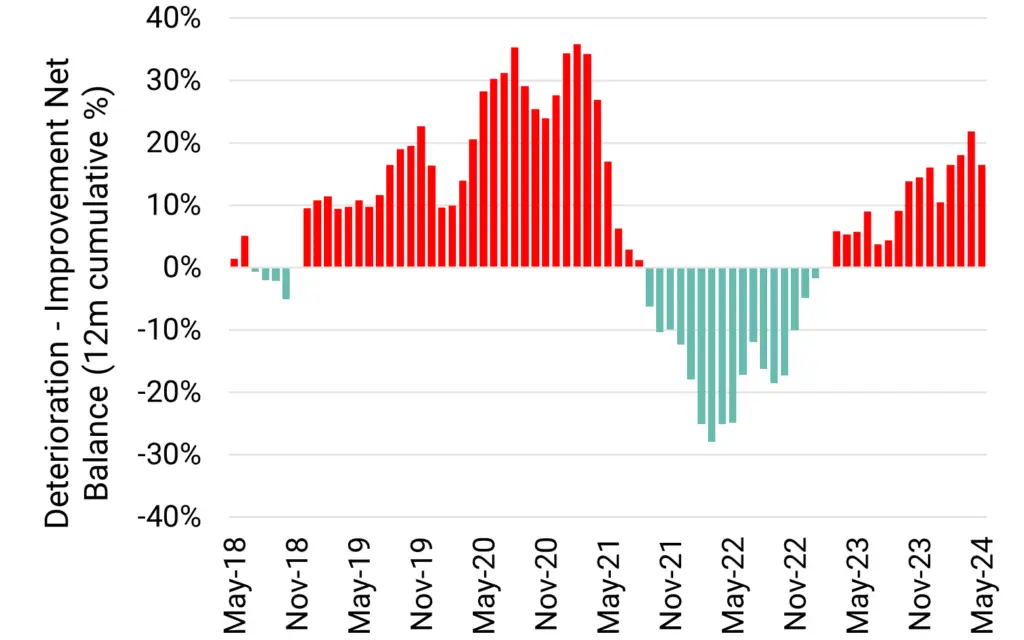
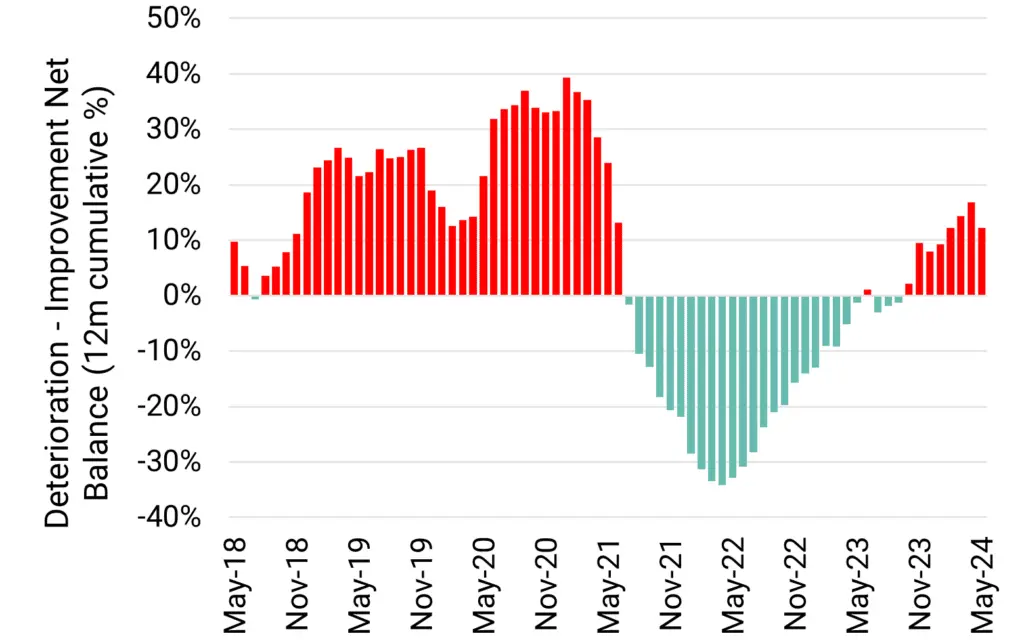
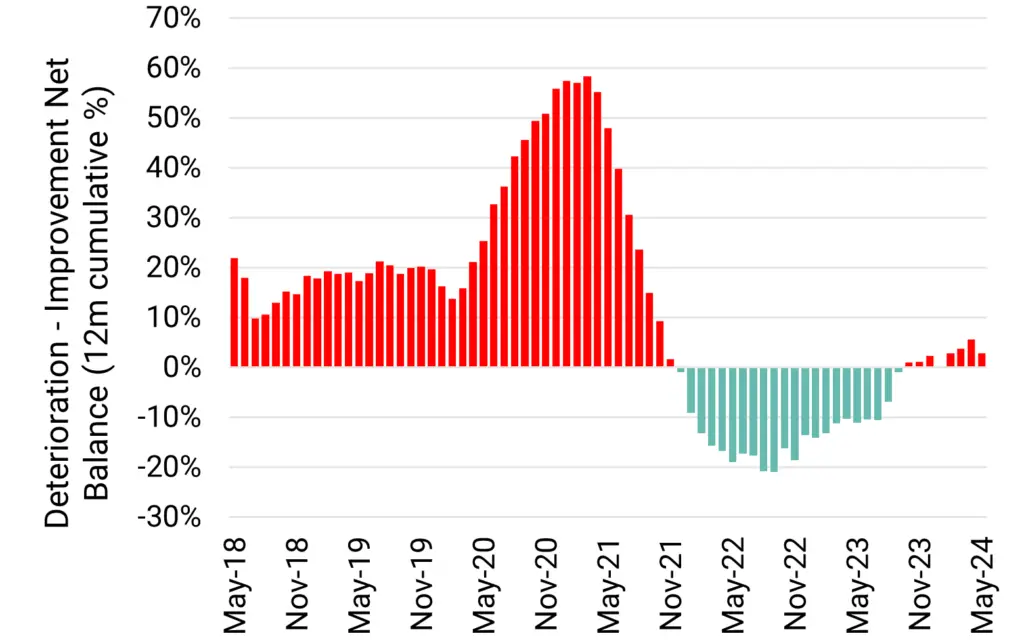
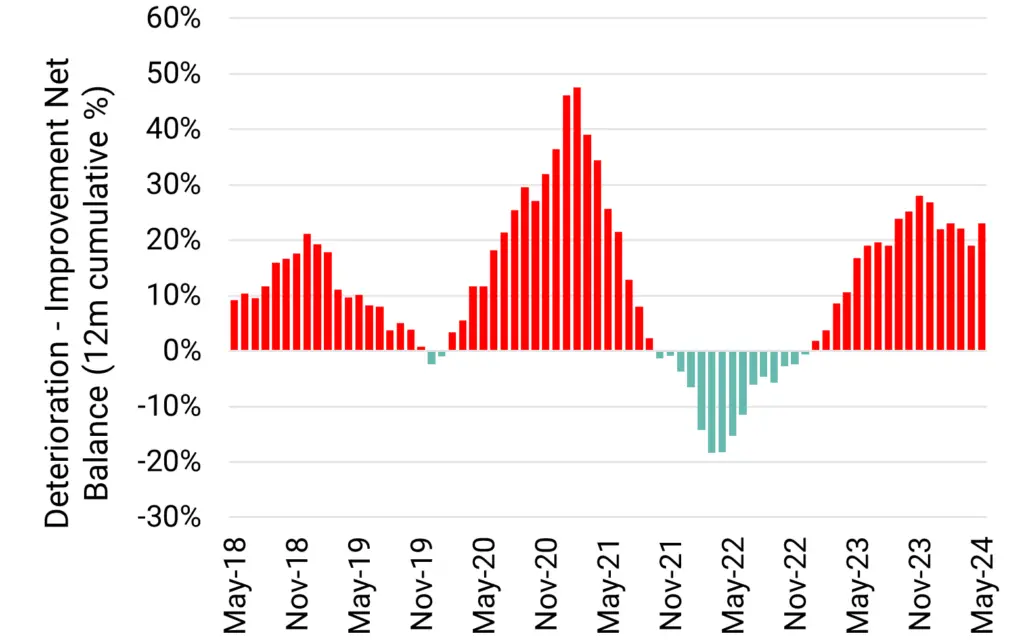
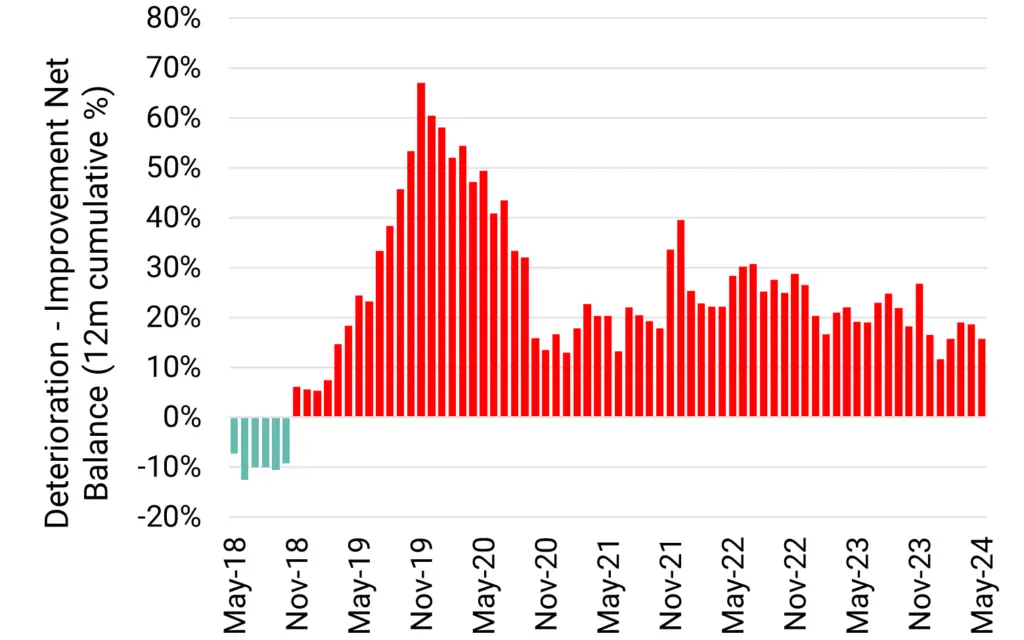
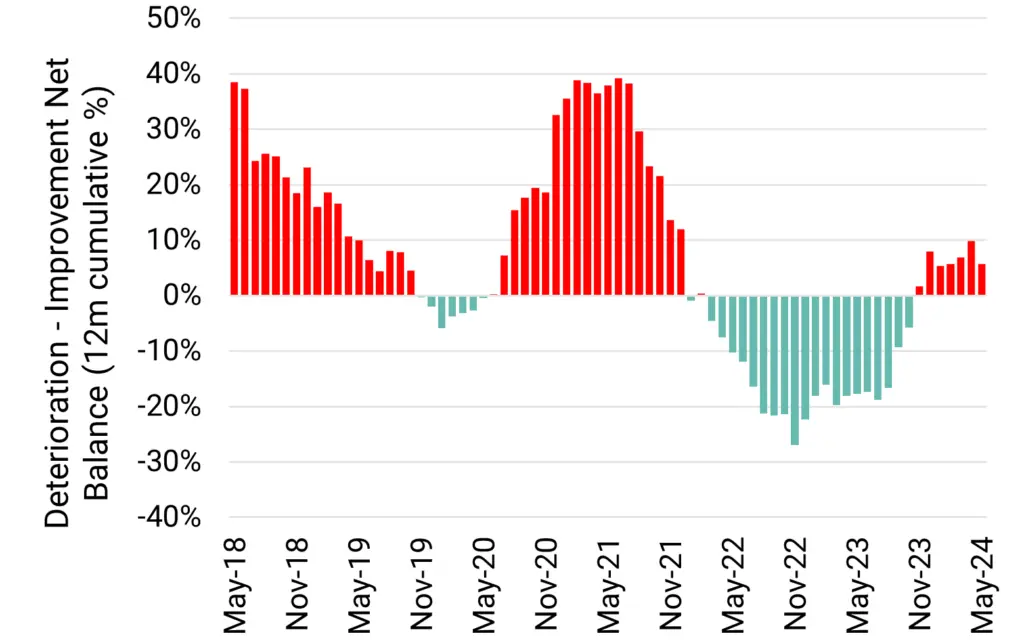
Deteriorations vs improvements % of total
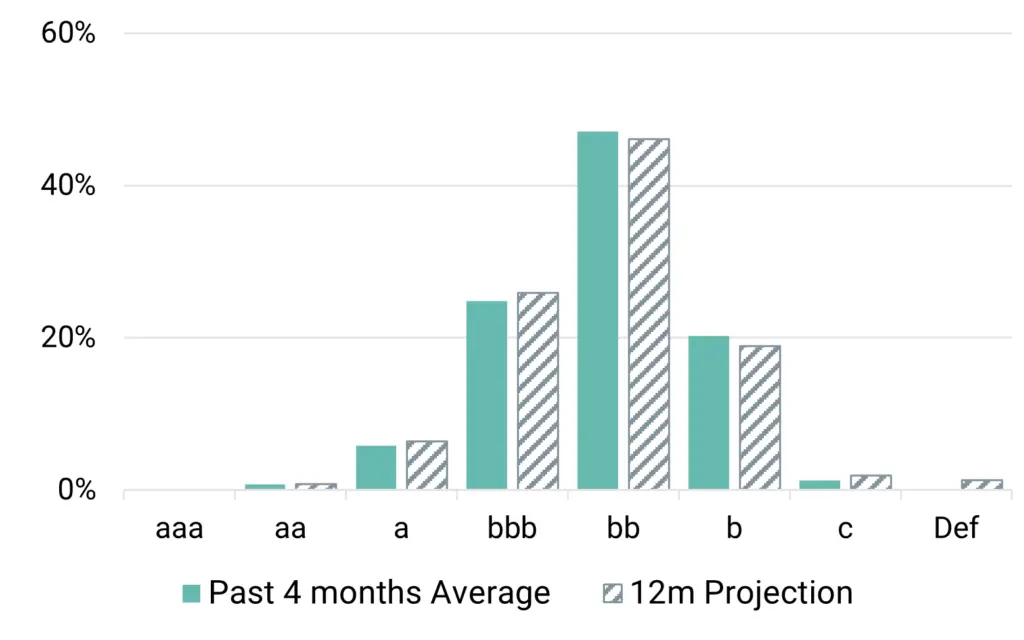
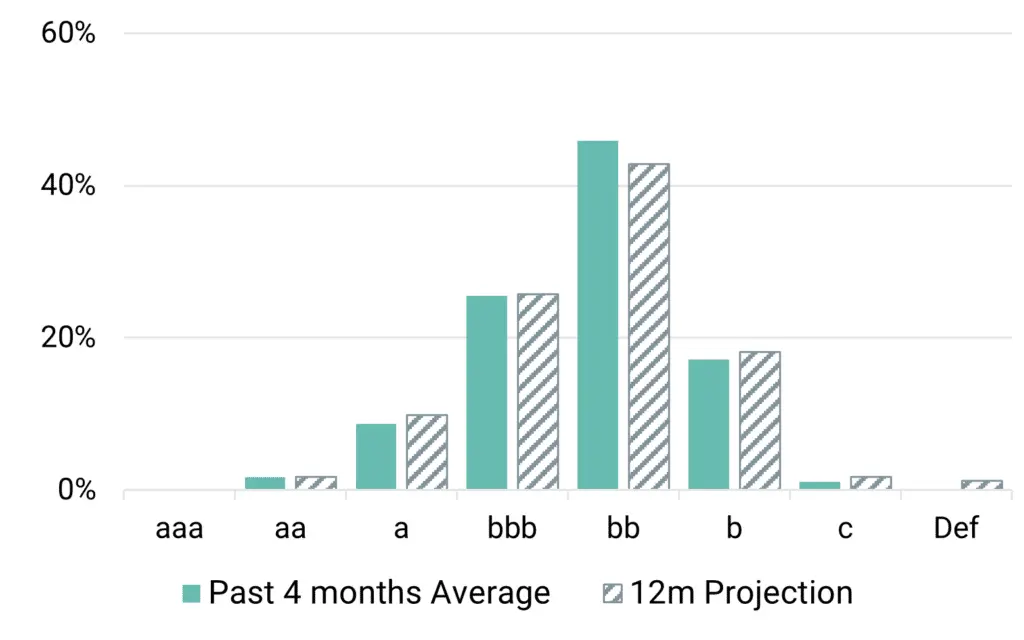
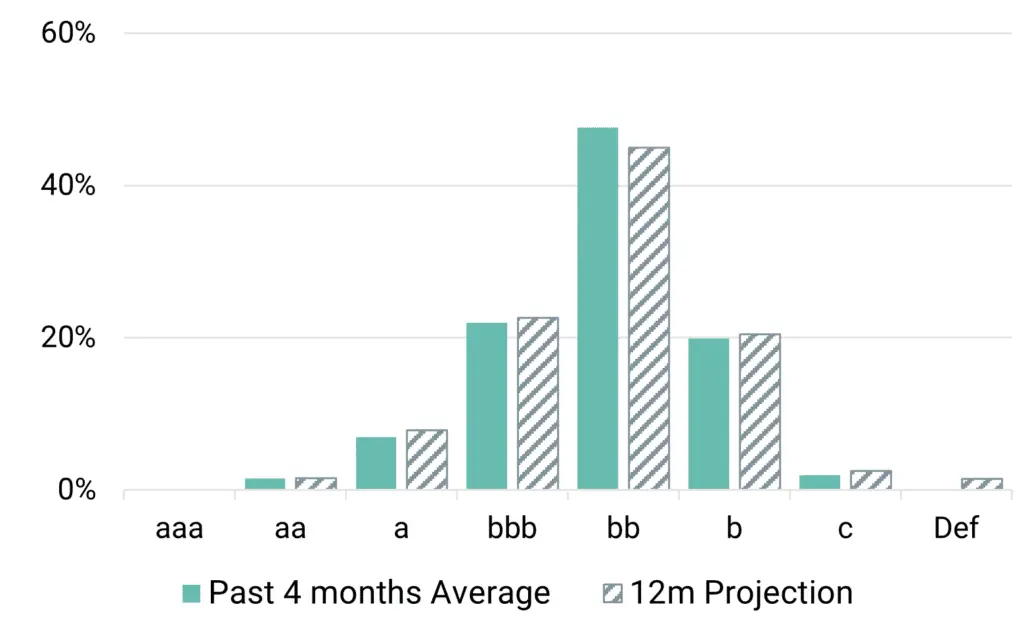
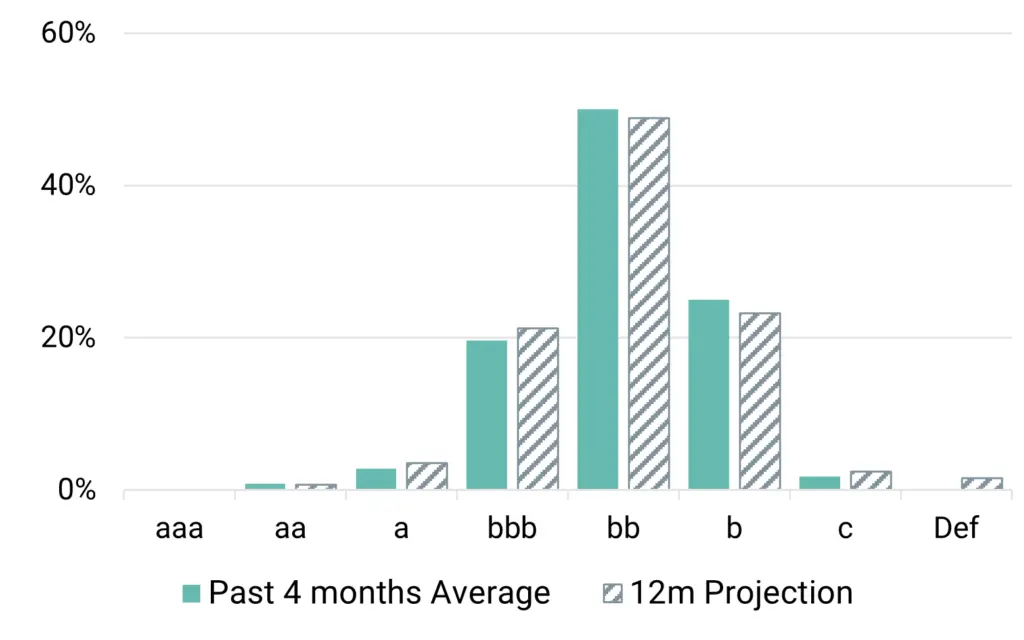
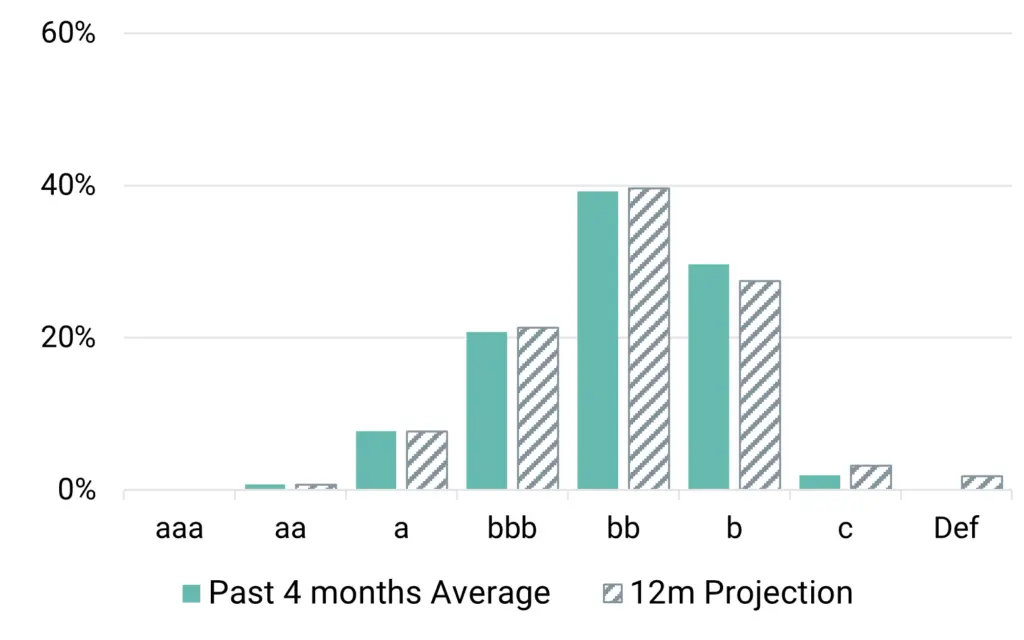
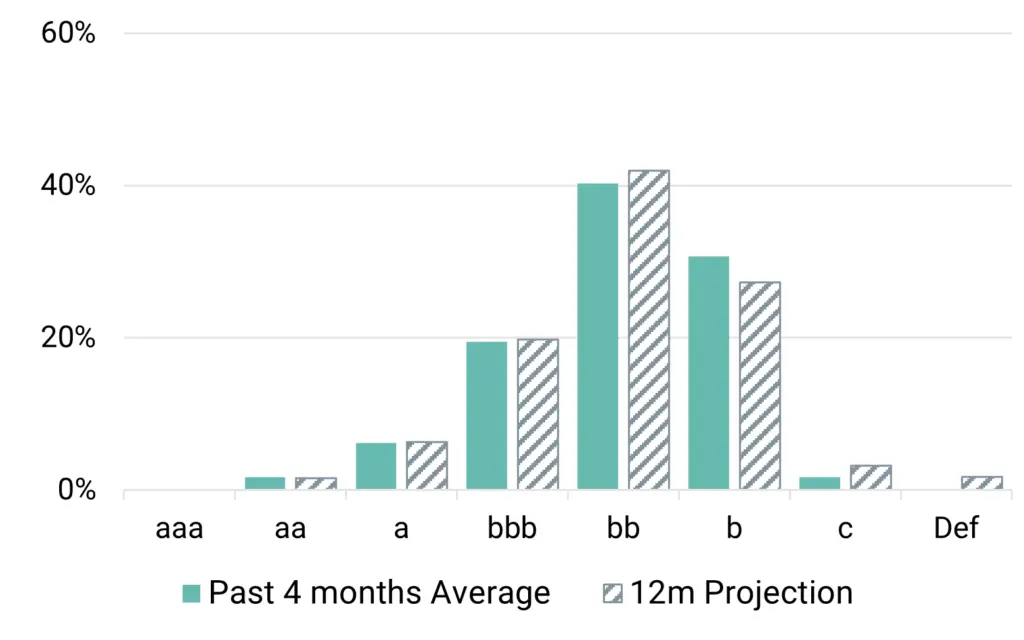
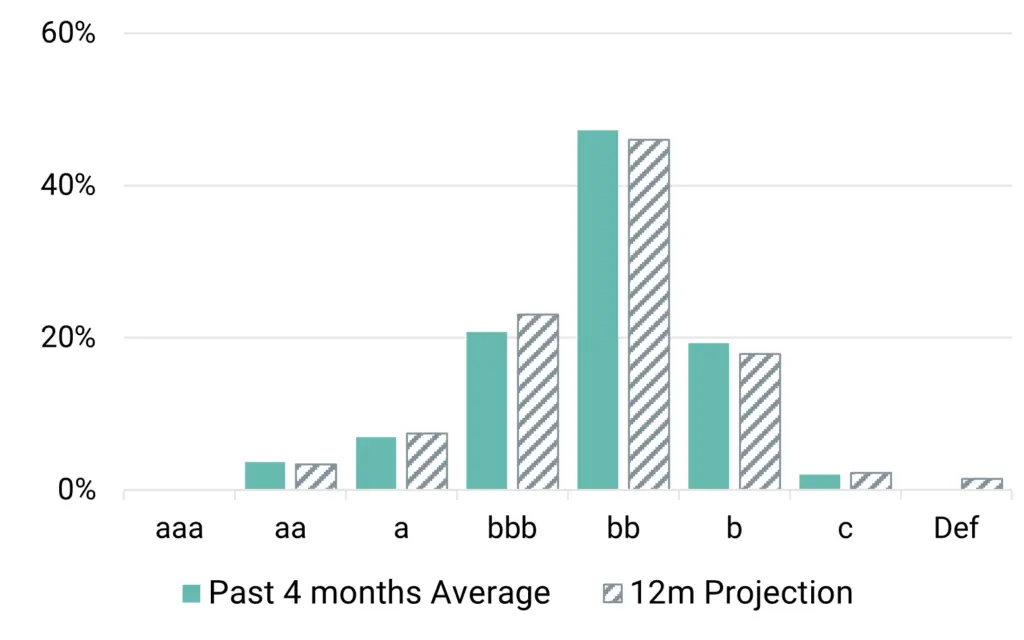
Distribution by rating category (%)
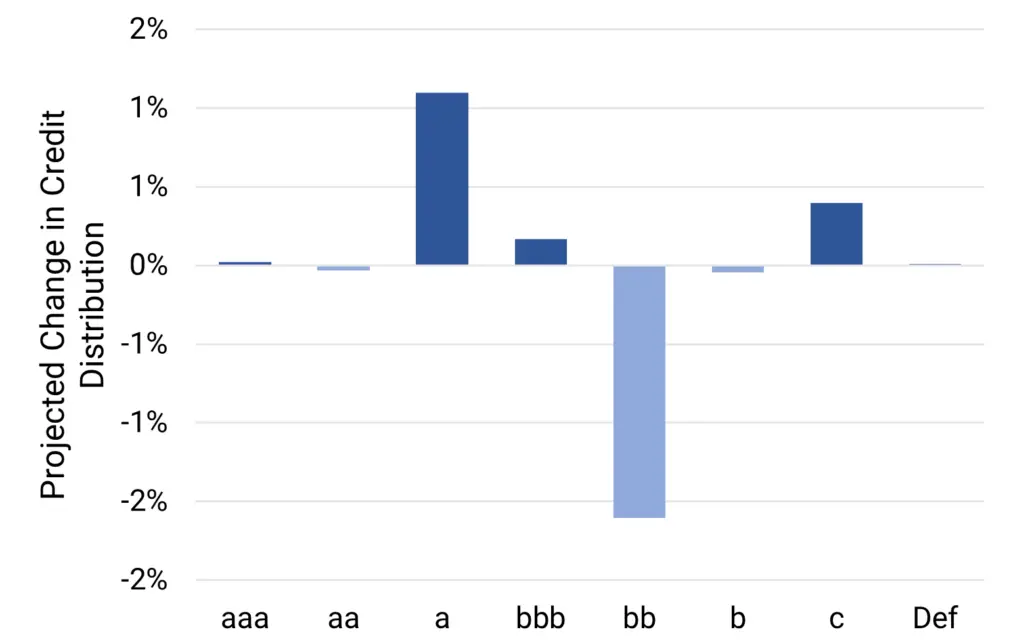
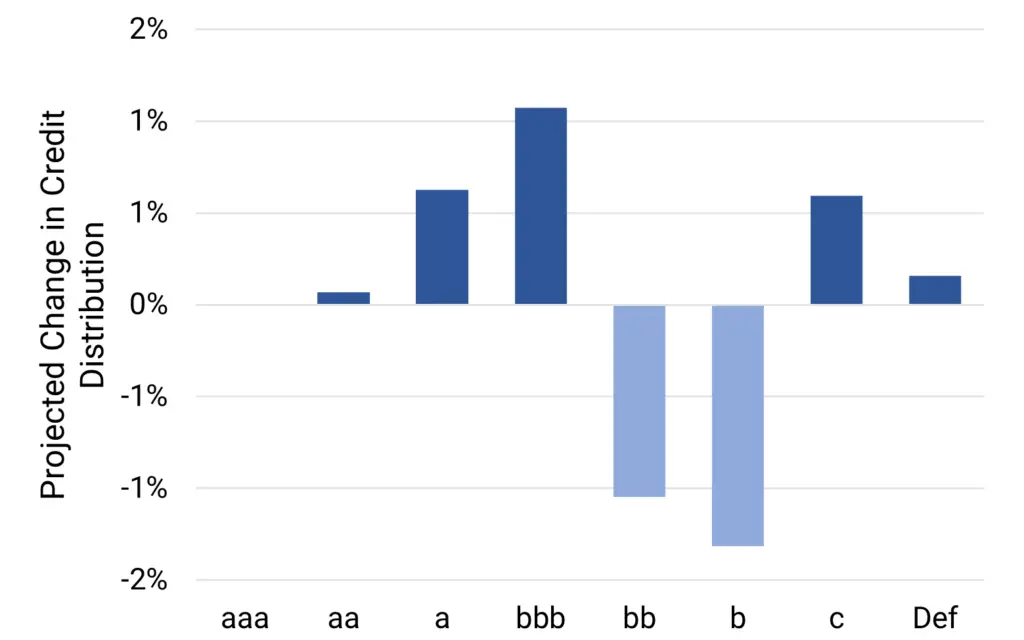
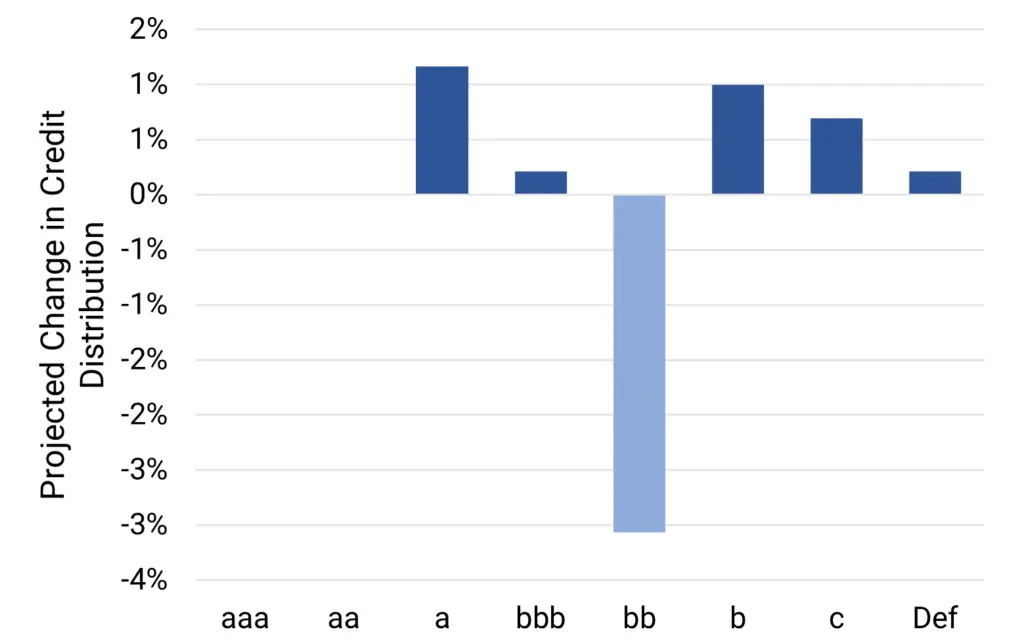
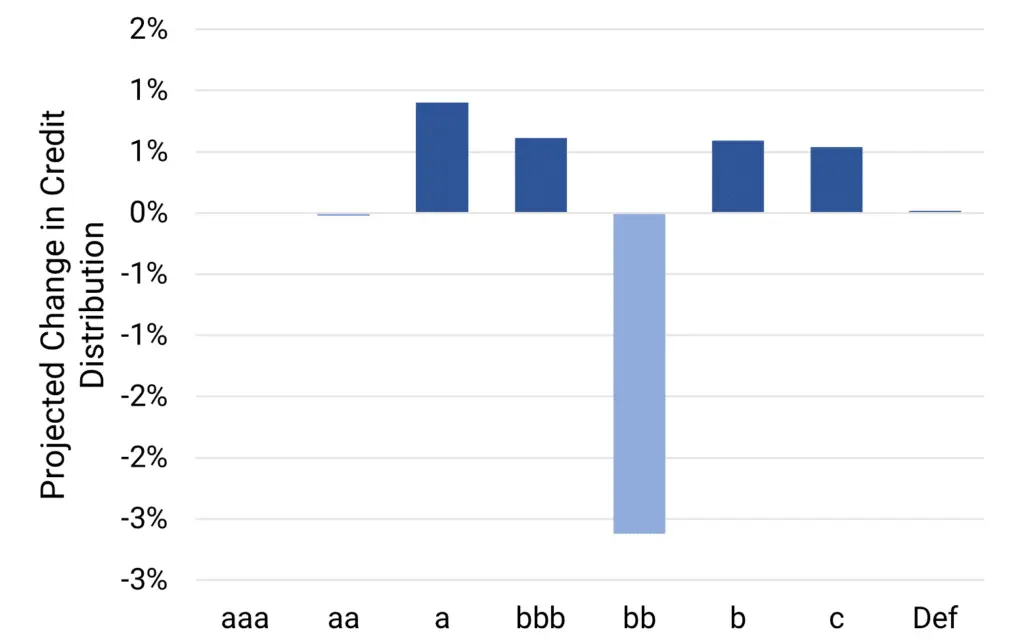
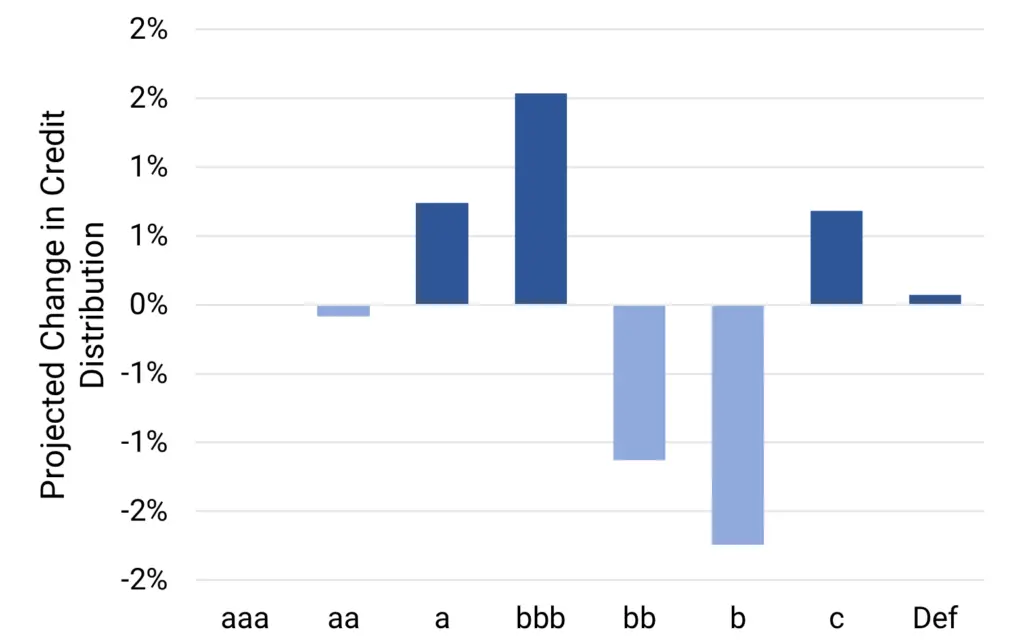
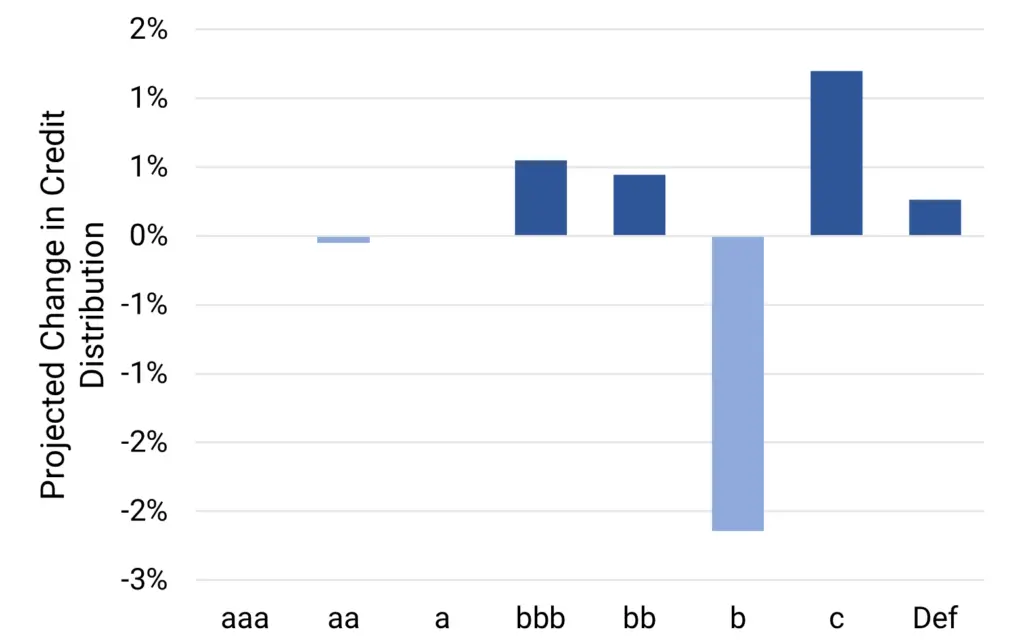
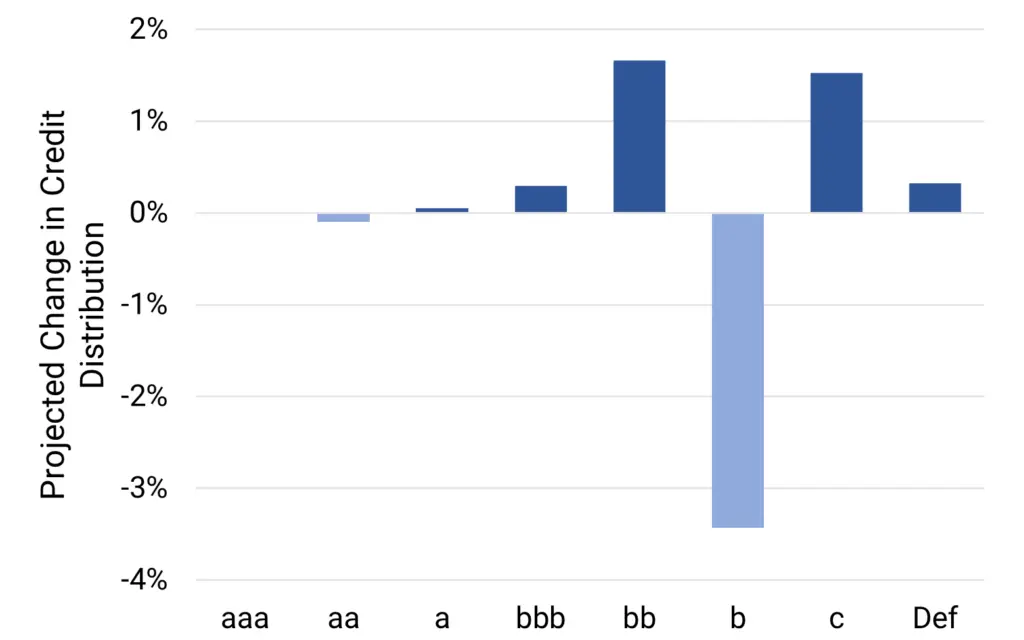
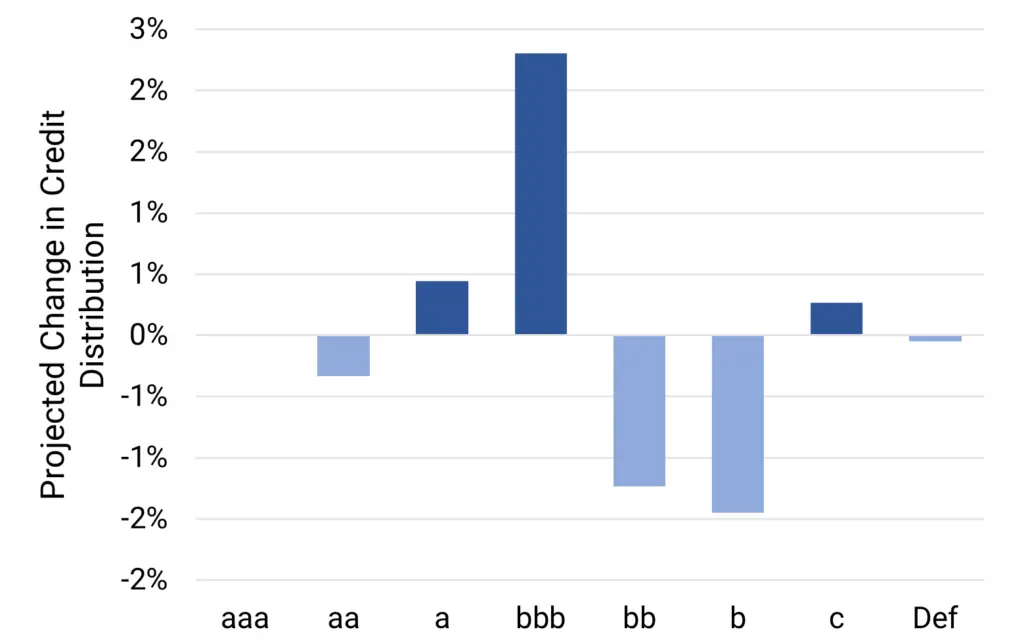
Projected change in credit distribution (%)
Key Takeaways
- We predict UK Financials default^ risks to increase by 6% in H2 2024 and H1 2025. Projections include a small drop (10% chance) but there is a 60% chance of an increase of 6% or more.
- Deteriorations outnumber Improvements; the balance has plateaued but has not yet swung back to Improvement.
- Credit migrations are being pulled to the credit distribution tails. We expect the ‘bb’ category to decrease, with shifts to ‘a’ and ‘c’; the latter is a key driver of the default rate.
- Credit Benchmark covers 2,304 UK Financial Institution obligors, 93% of which are not rated by a credit rating agency.
- Historic 2-year trend: Deterioration.
^ Default Risk is defined as a weighted average of S&P long-term observed default rates in each rating category, using the monthly sector credit breakdown as weights derived from contributed bank data.
Outlook for UK Oil & Gas
Default Risk outlook stable; but GB Energy plan will bring opportunities and risks for private energy majors. Current trends are skewed more to increase than decrease.
Projected 2024 default rate distribution
Deteriorations vs improvements % of total
Distribution by rating category (%)
Projected change in credit distribution (%)

Key Takeaways
- Median forecasts for the UK Oil & Gas sector show no change in default^ risks over the next 12 months. However, the outlook depends on post-Election policies on subsidies, exploration licences and taxation. There is a 40% chance of small increase, but a 20% chance of a drop of 10% or more.
- Deteriorations and Improvements are in balance but expect Deteriorations to dominate over next 12 months;this suggests high default risks by H2 2025.
- Credit migrations are mixed. We expect the ‘bb’ category to shrink, with upgrades to ‘bbb’ but also a small shift to the ‘b’ category.
- Credit Benchmark covers 277 UK Oil & Gas obligors, 94% of which are not rated by a credit rating agency.
- Historic 2-year trend: Stable.
^ Default Risk is defined as a weighted average of S&P long-term observed default rates in each rating category, using the monthly sector credit breakdown as weights derived from contributed bank data.
Outlook for UK Industrials*
Default rates to rise nearly 10% over next 12 months, but early investment boom could mitigate.
Projected 2024 default rate distribution
Deteriorations vs improvements % of total
Distribution by rating category (%)
Projected change in credit distribution (%)
Key Takeaways
- UK Industrials default^ rates are forecast to rise 9% by mid 2025. There is only a 10% chance of a modest drop, and a 10% chance of an increase exceeding the median forecast of 9%. However, this industry grouping is a bellwether for the UK economy; if Labour policies succeed in kickstarting an investment boom expect to see the signs here.
- Deteriorations are slightly ahead of Improvements; any significant shift towards net Improvements could mitigate the current projected increase in default risks.
- Credit migrations are mixed. We expect a shift from ‘bb’ and ‘b’ to ‘c’, but also some moves into ‘a’ and ‘bbb’.
- Credit Benchmark covers 3,241 UK Industrial obligors, 99% of which are not rated by a credit rating agency.
- Historic 2-year trend: Improving.
* Covering the manufacture of industrial goods and services, e.g., constructions materials, aerospace, electronic equipment and components, defense equipment, railroads, marine transportation, industrial machinery, commercial vehicles and trucks, etc.
^ Default Risk is defined as a weighted average of S&P long-term observed default rates in each rating category, using the monthly sector credit breakdown as weights derived from contributed bank data.
Outlook for UK Basic Materials*
Significant increase (16%) in default risks expected by mid-2025 as EIU expects China/US growth to ease while UK, Japan and EU take up some but not all slack.
Projected 2024 default rate distribution
Deteriorations vs improvements % of total
Distribution by rating category (%)
Projected change in credit distribution (%)
Key Takeaways
- UK Basic Materials default^ rates are predicted to increase by 16% over the next 12 months. There is a 10% chance of a small drop, but a more than 50% chance of an increase in the 15% – 20% range.
- Deteriorations have risen sharply relative to Improvements. While this may plateau, it will take time for the global cycle to swing to significant net Improvement. NB: this industry group has been in net Deterioration for most of the past 5 years.
- Credit migrations show modest downgrade shift. We expect the ‘bb’ category to shrink, with transitions to the ‘b’ and ‘c’ categories as well as some upgrades to ‘a’.
- Credit Benchmark covers 471 UK Basic Materials obligors, 98% of which are not rated by a credit rating agency.
- Historic 2-year trend: Deteriorating
* Covering the mining industries for aluminum, iron, steel, coal, gold platinum and precious metals, non-ferrous metals, as well as forestry and paper products.
^ Default Risk is defined as a weighted average of S&P long-term observed default rates in each rating category, using the monthly sector credit breakdown as weights derived from contributed bank data.
Outlook for UK Consumer Goods
Consumer Goods show a modest increase in default rates; but could overshoot. Post-election policies unlikely to have immediate material impact.
Projected 2024 default rate distribution
Deteriorations vs improvements % of total
Distribution by rating category (%)
Projected change in credit distribution (%)
Key Takeaways
- We predict UK Consumer Goods to show a small (5%) increase in default^ risks into 2025. There is a small chance of a decrease, but a 25% chance of an increase of closer to 10%.
- Deteriorations currently modestly outweigh Improvements, but in previous cycles this sector has made large shifts. If deteriorations spike again, a further increase in default rates is possible in H2 2025.
- Credit migrations show movement to the tails. The ‘bb’ sector is expected to shrink, with migrations to both lower HY and lower IG categories.
- Credit Benchmark covers 1,223 UK Consumer Goods obligors, 98% of which are not rated by a credit rating agency.
- Historic 2-year trend: Stable.
^ Default Risk is defined as a weighted average of S&P long-term observed default rates in each rating category, using the monthly sector credit breakdown as weights derived from contributed bank data.
Outlook for UK Consumer Services
Consumer Services at risk of modest deterioration in 2025 but – unlike Consumer Goods – there is a material chance of improvement.
Projected 2024 default rate distribution
Deteriorations vs improvements % of total
Distribution by rating category (%)
Projected change in credit distribution (%)
Key Takeaways
- UK Consumer Services are also forecast to post a 5% rise in default^ rates by mid-2025. However, there is a 30% chance of a material drop in the 10% – 15% range. There is a small chance that any increase exceeds 10%.
- Deteriorations and Improvements are currently in balance. The past few years have been skewed to Deterioration but current trends imply limited downside.
- Credit migrations show a mixed picture for 2025. The ‘bb’ and ‘b’ categories are being squeezed, with some moves to the high default risk ‘c’ category but a noticeable shift to the lower IG area as well.
- Credit Benchmark covers 2,265 UK Consumer Services obligors, 98% of which are not rated by a credit rating agency.
- Historic 2-year trend: Improving.
^ Default Risk is defined as a weighted average of S&P long-term observed default rates in each rating category, using the monthly sector credit breakdown as weights derived from contributed bank data.
Outlook for UK Technology
Projected 2024 default rate distribution
Deteriorations vs improvements % of total
Distribution by rating category (%)
Projected change in credit distribution (%)
Key Takeaways
- We predict the UK Technology sector to show a marked increase (+13%) in default^ risks into 2025, continuing a long-term trend increase. There is only a limited chance of a small improvement, but deterioration in the 10% – 20% range is much more likely.
- Deteriorations vs. Improvements are at their highest level since 2020. The balance is now dropping slowly; periods of net improvement have been short in previous cycles.
- Credit migrations show a bias to downgrades. Projections show a major shift out of the ‘b’ category, mainly into ‘c’ but with some upgrades to ‘bb’ and ‘bbb’.
- Credit Benchmark covers 430 UK Technology obligors, 98% of which are not rated by a credit rating agency.
- Historic 2-year trend: Deteriorating.
^ Default Risk is defined as a weighted average of S&P long-term observed default rates in each rating category, using the monthly sector credit breakdown as weights derived from contributed bank data.
Outlook for UK Telecoms
Sector needs major infrastructure and funding overhaul; global move to satellite suggests credit challenges persisting in 2025.
Projected 2024 default rate distribution
Deteriorations vs improvements % of total
Distribution by rating category (%)
Projected change in credit distribution (%)
Key Takeaways
- The UK Telecoms sector is projecting another sizeable increase (+14%) in default^ risks, continuing its long-term decline. The upper bound of the projected range suggests increases of 20%+. There is limited scope for a major drop, and that would be conditional on a burst of M&A in the sector. Persistent deterioration into H2 2025 is likely.
- Deteriorations continue to outnumber Improvements although the balance is well below its long term high. It is unlikely to move towards sustained Improvement anytime soon.
- Credit migrations are equally split between upgrades and downgrades, but the increase in the ‘c’ category the key issue as the main source of defaults. Projections show a squeeze in the ‘b’ category with moves into the ‘bb’ and ‘c’ categories.
- Credit Benchmark covers 122 UK Telecomms obligors, 94% of which are not rated by a credit rating agency.
- Historic 2-year trend: Deteriorating.
^ Default Risk is defined as a weighted average of S&P long-term observed default rates in each rating category, using the monthly sector credit breakdown as weights derived from contributed bank data.
Outlook for UK Health Care
NHS reforms will take time to benefit private suppliers, but some private care providers may benefit from ability-to-pay approach.
Projected 2024 default rate distribution
Deteriorations vs improvements % of total
Distribution by rating category (%)
Projected change in credit distribution (%)
Key Takeaways
- Our UK Health Care forecast is for little change in default^ risk. There is a 10% chance that mid-2025 default rates drop from current levels, but most projections are higher with the upper bound close to an 8% increase.
- Deteriorations vs. Improvements are close to balance, but modest move to Improvement likely by mid-2025.
- Credit migrations are skewed towards the ‘bbb’ category, but small jump in ‘c’ risks pull average default risk slightly up. General trend is towards upgrade from high yield to investment grade.
- Credit Benchmark covers 388 UK Health Care obligors, 98% of which are not rated by a credit rating agency.
- Historic 2-year trend: Stable.
^ Default Risk is defined as a weighted average of S&P long-term observed default rates in each rating category, using the monthly sector credit breakdown as weights derived from contributed bank data.
Selected Mid-Scale Sectors
| Largest Deterioration (Default Rate increase >+10%) |
| Household Goods & Home Construction |
| Food & Drug Retailers |
| Real Estate Holding & Development |
| Chemicals |
| Industrial Machinery |
| Media |
| Hotels |
| Building Materials & Fixtures |
| Computer Services |
| Construction & Materials |
Home Construction will continue to be hit by higher mortgage rates, with some resets only now making an impact (planning reform should be a boost to the sector longer term, but meeting housebuilding targets runs the risk of lower margins.)
Real Estate generally – especially Offices – is also expected to continue to suffer, along with Household Goods, Building Materials, and Construction Materials.
Other discretionary spending sectors – Media and Hotels – are expected to continue to deteriorate along with essentials such as Food & Drug Retailers.
Chemicals, Industrial Machinery, and Computer Services are likely to be medium-term beneficiaries of a pro-investment policy stance.
| Largest Improvement (Default Rate increase <0%) |
| Aerospace & Defence |
| Insurance |
| Specialty Finance |
| Pharmaceuticals & Biotechnology |
| Beverages |
| Restaurants & Bars |
| Automobiles & Parts |
| Travel & Leisure |
| Oil & Gas Producers |
| Broadline Retailers |
A limited number of sectors are projected to show modest default rate improvements over the next 12 months. Geopolitics will continue to drive improvement in Aerospace and Defence.
Spending habits focused on small tickets will support hospitality and leisure segments, while insurance continues to benefit from harder rates in Property & Casualty lines.
Specialty Finance is at the core of the Private Credit boom – attracting additional funding as well as increased regulator scrutiny.
AI is helping Pharma & Biotech to shorten development cycles.
Plans to tackle climate change are still in direct conflict with the immediate demand for petrol-driven transport; Oil & Gas and Autos & Parts are forecast to see default risk improvements into 2025.
Contact Credit Benchmark for more details on any of these sectors.
Download PDF
Please complete your details to download the PDF of this report:
Appendix
Additional definitions and explanations
- All projections cover H2 2024 and H1 2025.
- The historic data set that we used for our projections is based only on derived metrics from one-year ex ante probability of default (“PD”) estimates contributed by major global banks to Credit Benchmark. No external micro- or macro-level data was used.
- The reported “Default Rate” is defined as a weighted average of S&P’s long-term observed default rates in each of the seven main rating categories (from “aaa” down to “c”), using the monthly sector credit breakdown as weights derived from contributed bank data.
- This gives an index of default risk combined across investment-grade and high-yield borrowers, and this index only changes when contributing banks amend the credit classification of borrowers. It is therefore directly linked to changes in transition rates, which can be tracked and potentially predicted via the deterioration vs improvement net balance, which records ALL movements in single-name PDs across all rating categories.
- Our projections are a combination of three types:
The proportion of sector borrowers projected to be in the “c” category by H1 2025. The majority of defaulting borrowers will transition from this category.
The rolling 12m net balance of deteriorations vs improvements (“DIN”) across all credit categories in each sector, projected to the end of H1 2025. This is used to weight peak and trough transition matrices as a function of the sector credit cycle phase.
The modelled default rate projected directly to end H1 2025.
Industry credit “betas” estimated from historical long run relationships with the Corporate index, and then projected as a function of the Corporate Index projections. This provides an element of consistency and anchoring across the otherwise independently projected industries.
- All projection types use multiple historic periods to give a range of future possible outcomes. Many of these give similar results, but some project large outliers in either tail of the distribution.
- Reported ranges cover the 10th to 90th percentiles, and the central case is based on the 50th percentile.