Credit Benchmark’s EU Default Risk Outlook draws on an extensive database of over 100,000 unique Credit Consensus Ratings (CCRs). These CCRs represent the internal risk views of expert analysts at the world’s leading banks – a previously untapped source of risk intelligence. 90% of the entities with CCRs are not rated by a major credit rating agency, meaning these projections offer a new and significant capacity for analysing default risk.
Although this report focuses on EU Industries, the methodology can be applied to the broad and highly representative dataset of 100,000+ CCRs (see here for US Industries Default Risk Outlook). The default projections can be customized for our clients to match their own classification schemas and align more accurately with their portfolios and exposures.
Vigilant risk management is vital when navigating an unpredictable economic climate. With broader, deeper, and more frequent analytics than previously available, Credit Benchmark is now able to offer the market a comprehensive and differentiated view on default risks.
If you would like a free and fully confidential analysis of the default risk projections of your own portfolio, we encourage you to get in touch here.
Default risks mainly peaking by end 2024 but further improvements may stall if inflation surprises delay ECB rate cuts
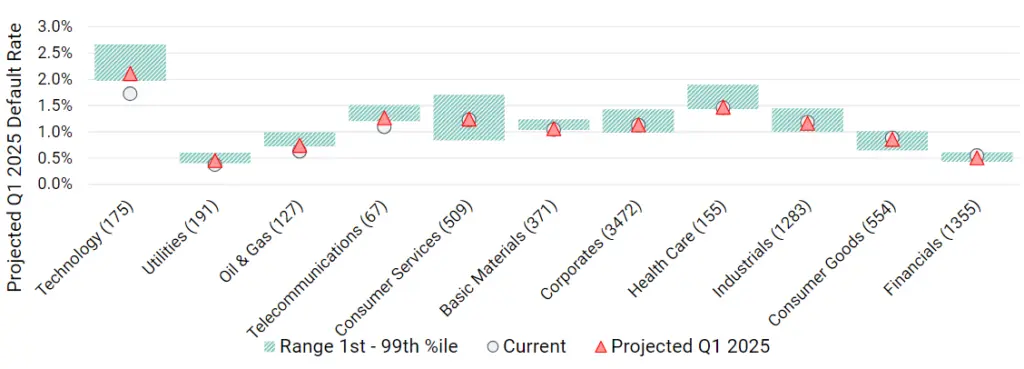
Credit Benchmark’s projected default rate for 2024/25
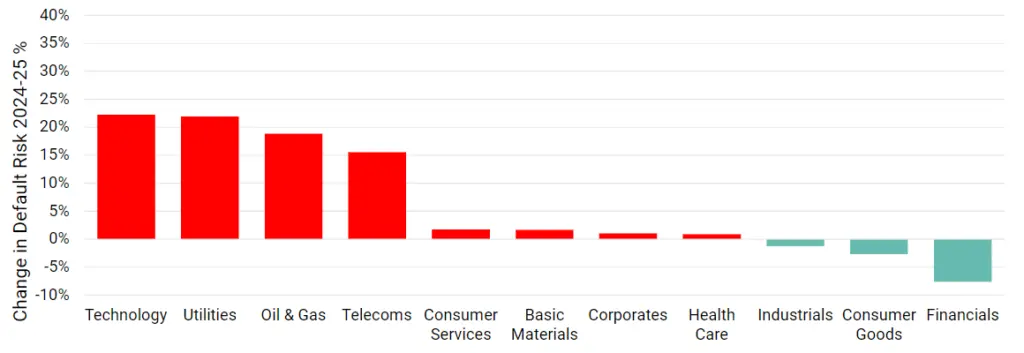
Change (%) in the probability of default (PD) during 2023/24
Key Takeaways
We predict that default^ risks will rise slightly in H2 2024 as weak EU growth persists, but most sector default rates should return to current levels by early 2025, if ECB cuts rates in June in line with market expectations.
Financials, Industrials and Consumer Goods are expected to show modest drops in default rates by Q1 2025.
Corporates, Health Care, Basic Materials and Consumer Services are unchanged or slightly higher.
Technology and Telecoms could see a significant rise. Oil & Gas and Utilities are expected to show moderate % increases, from lower base default rates.
S&P expectations are for High Yield default rates to peak earlier and fall back to end 23 levels by end 24. Optimistic is 40% lower; Pessimistic is 40% higher.
^ Default Risk is defined as a weighted average of S&P long-term observed default rates in each rating category, using the monthly sector credit breakdown as weights derived from contributed bank data.
Outlook for EU Non-Financial Corporates*
Default risks to rise in H2 2024 but return to current levels by Q1 2025
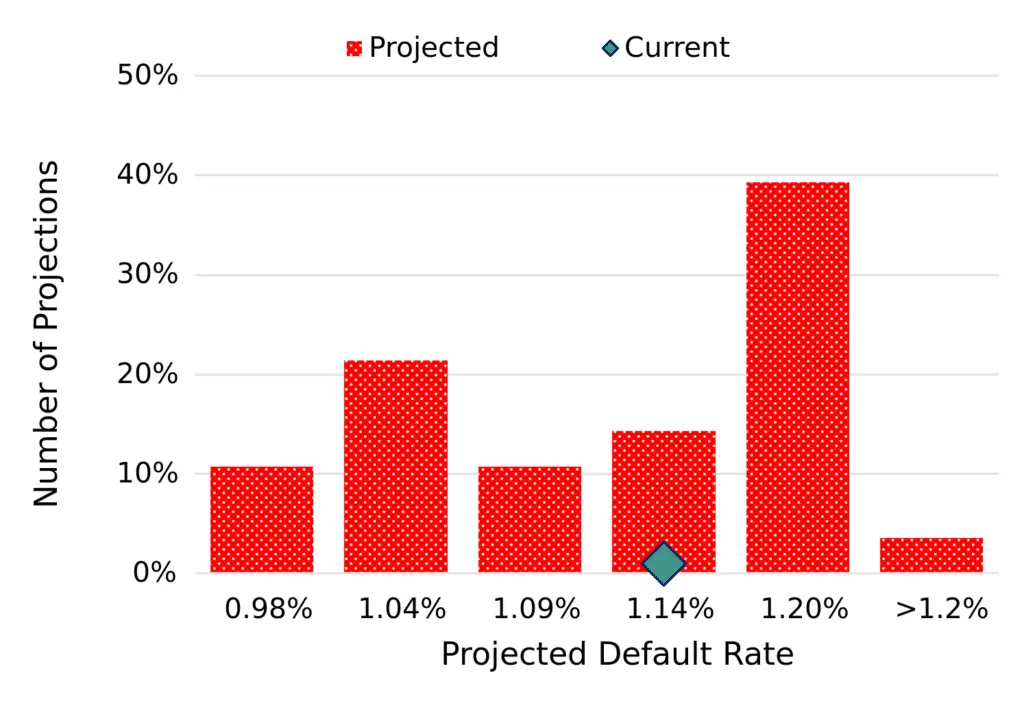
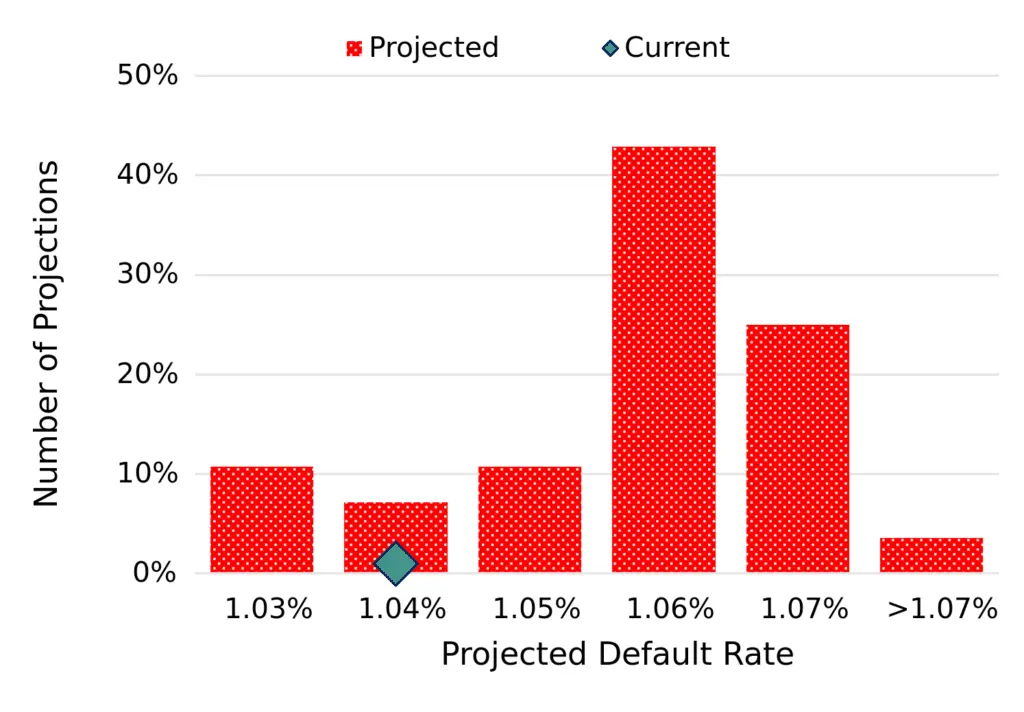
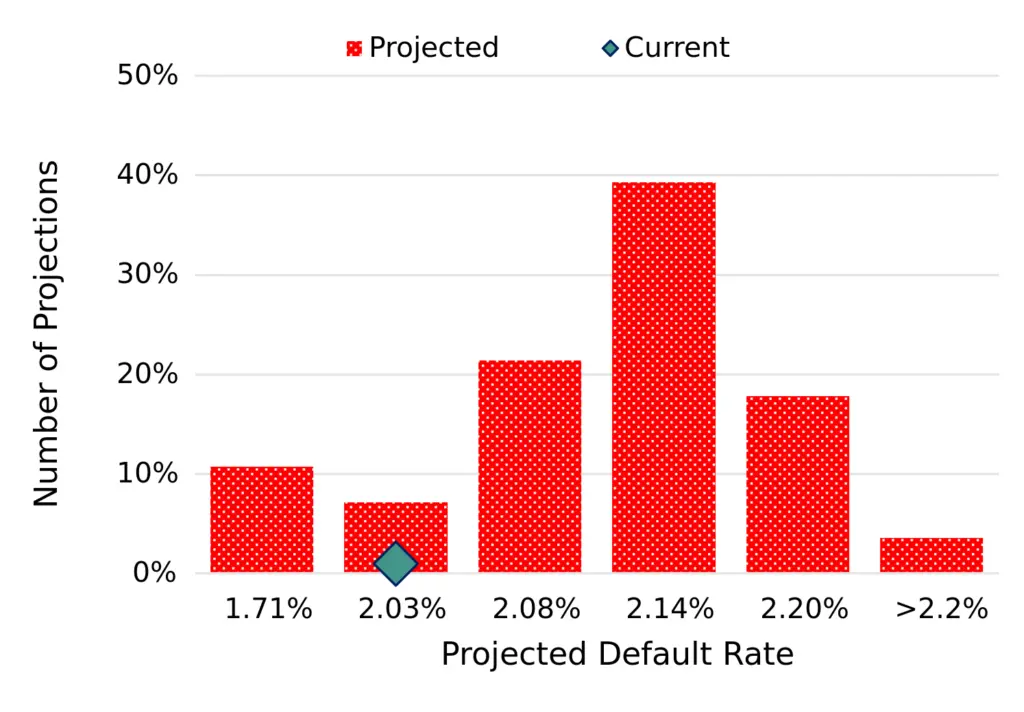
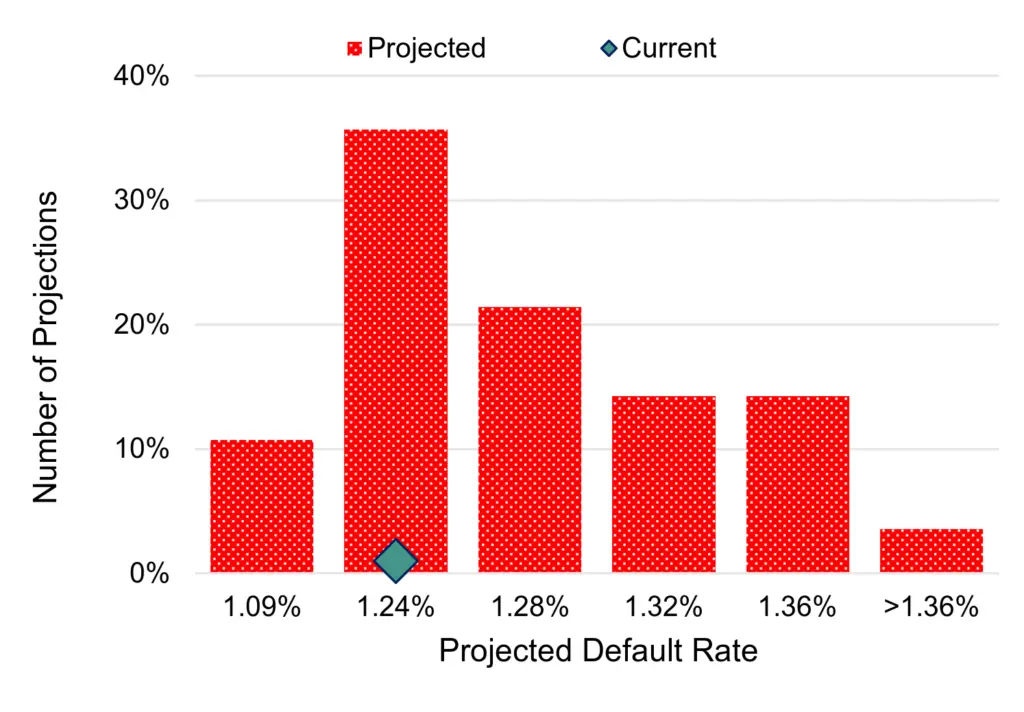
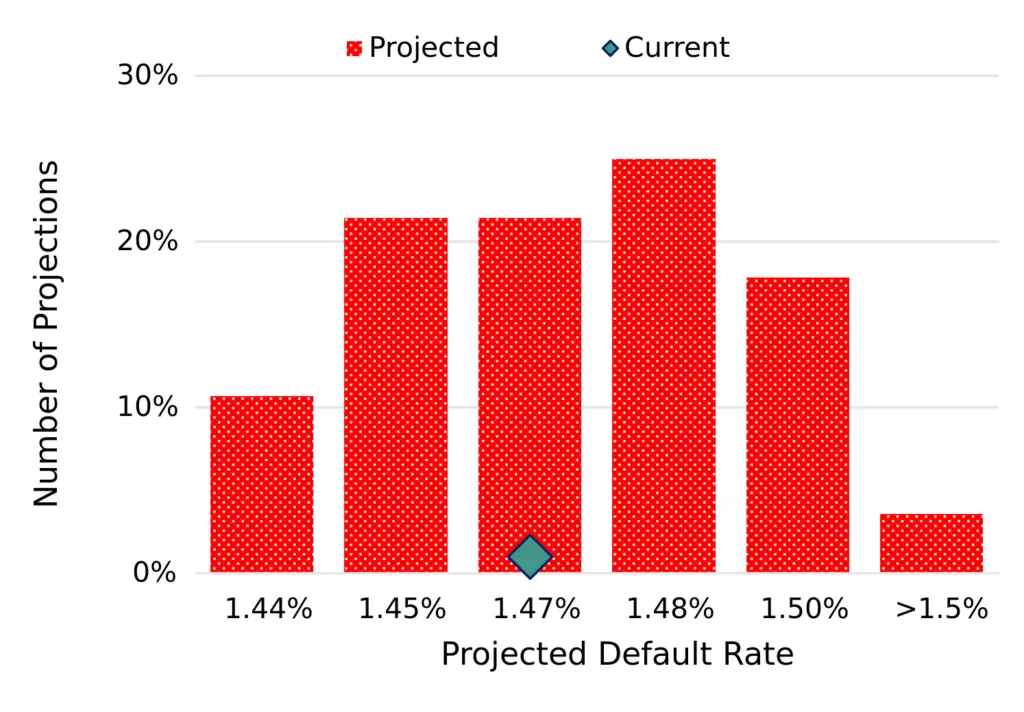
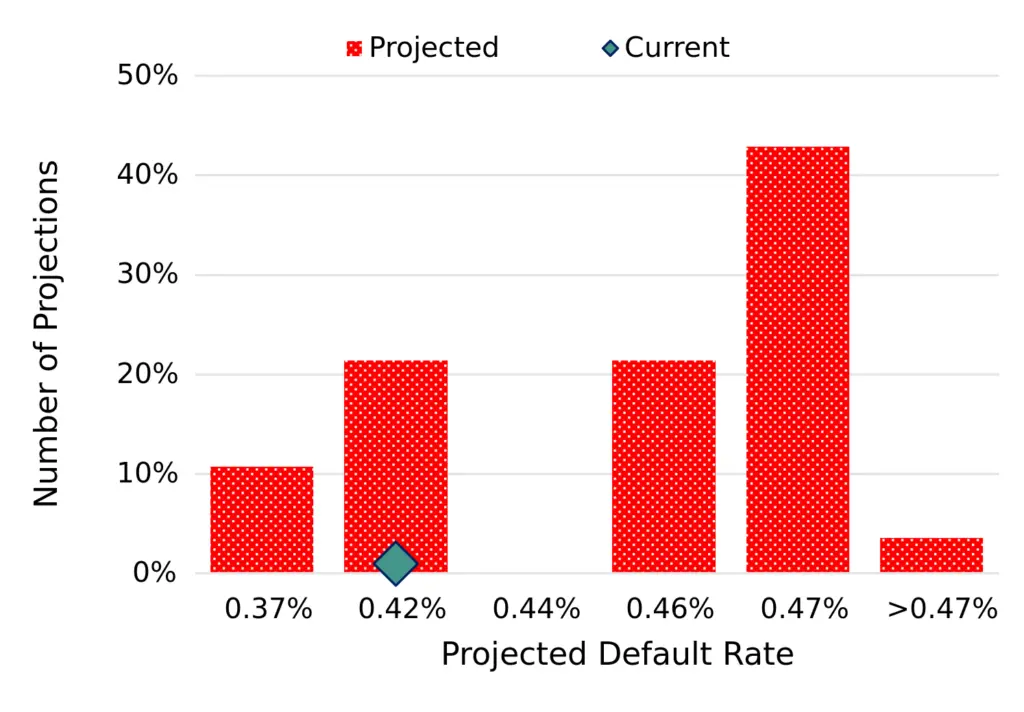
Projected 2024 default rate distribution
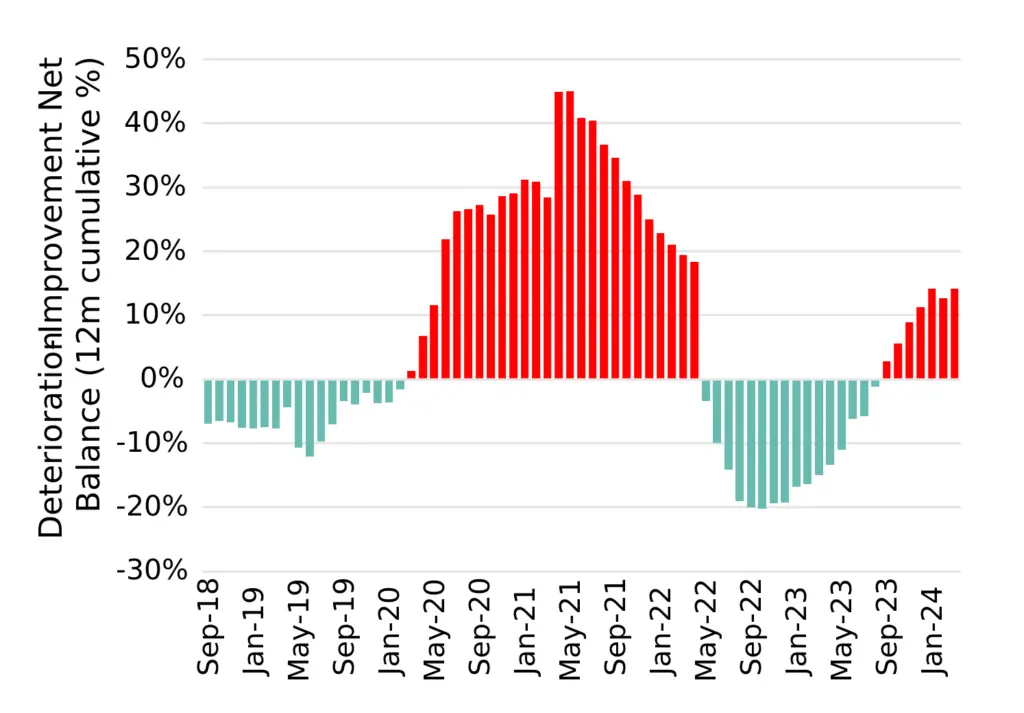
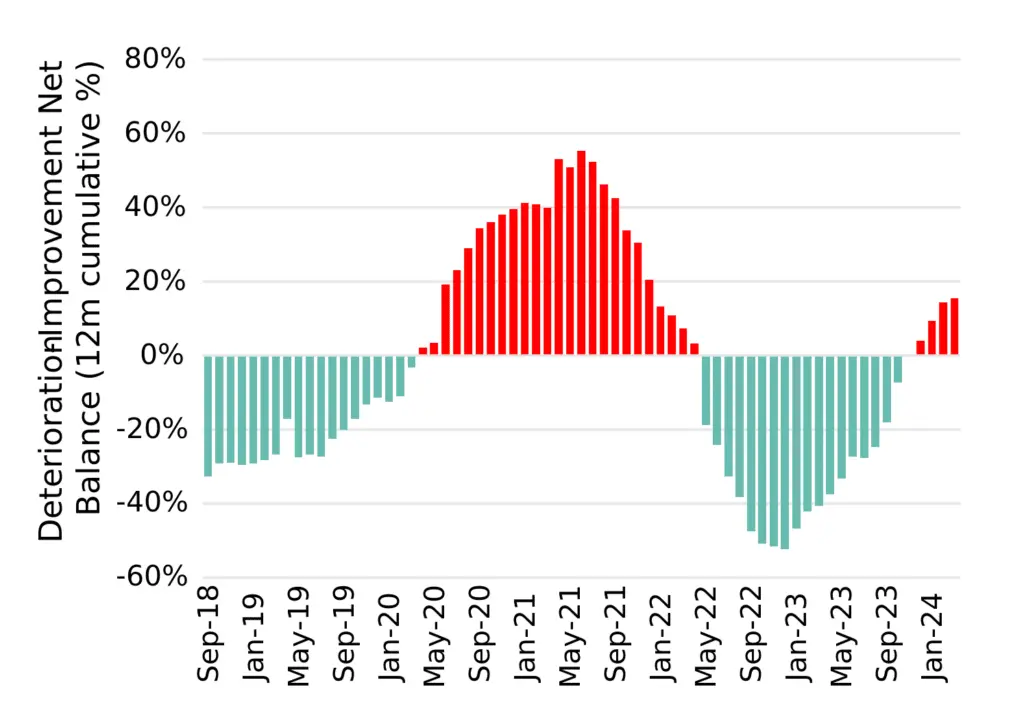
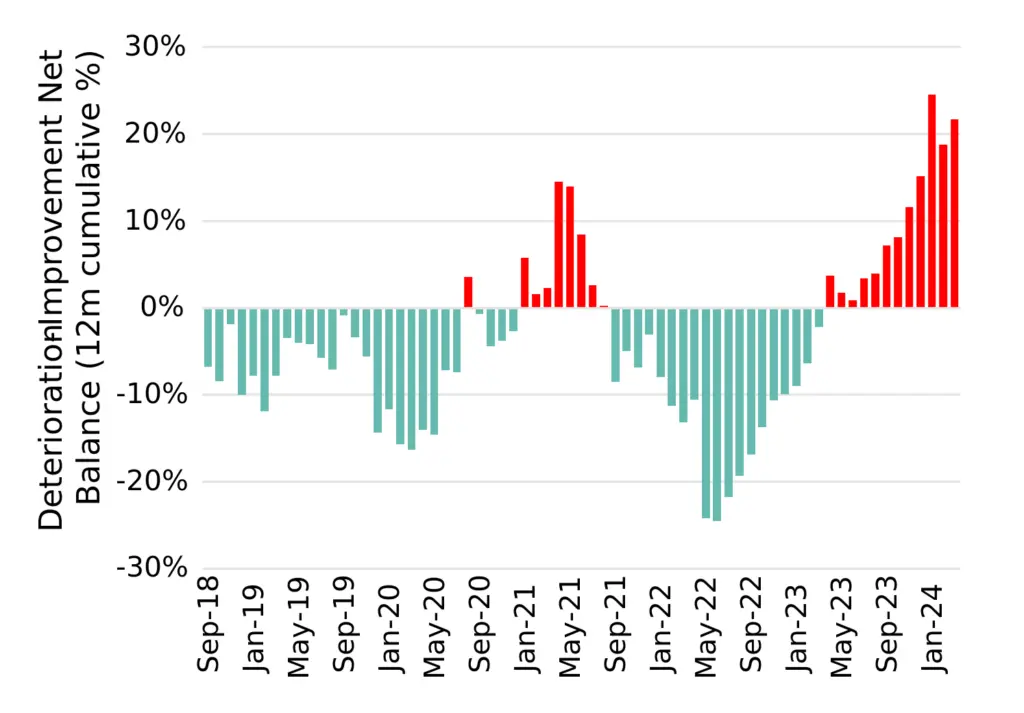
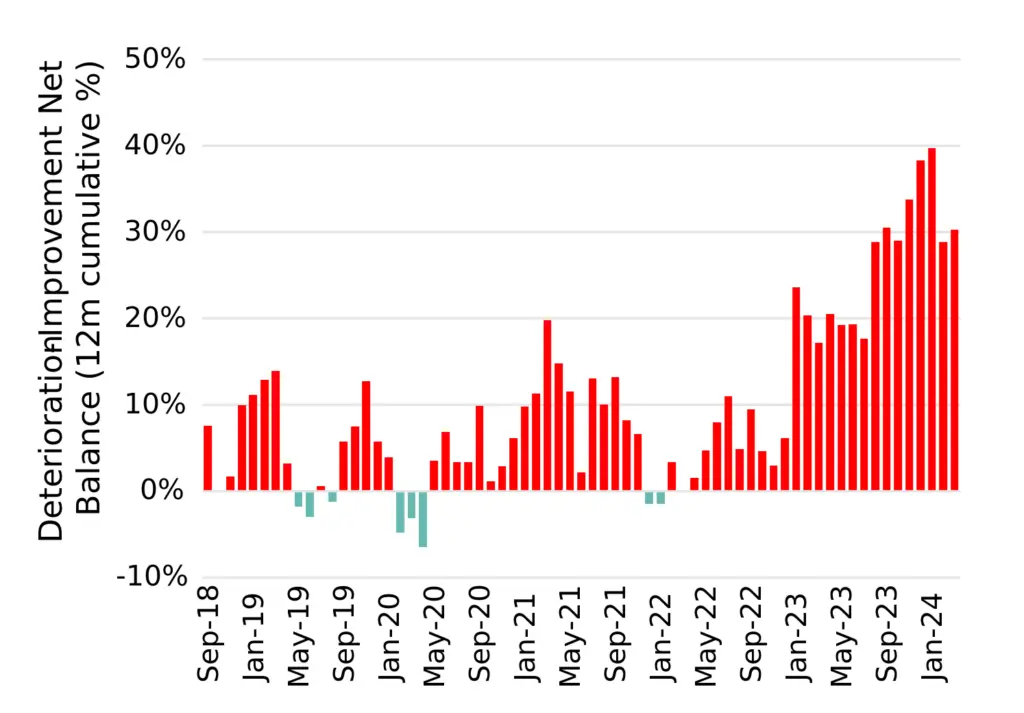
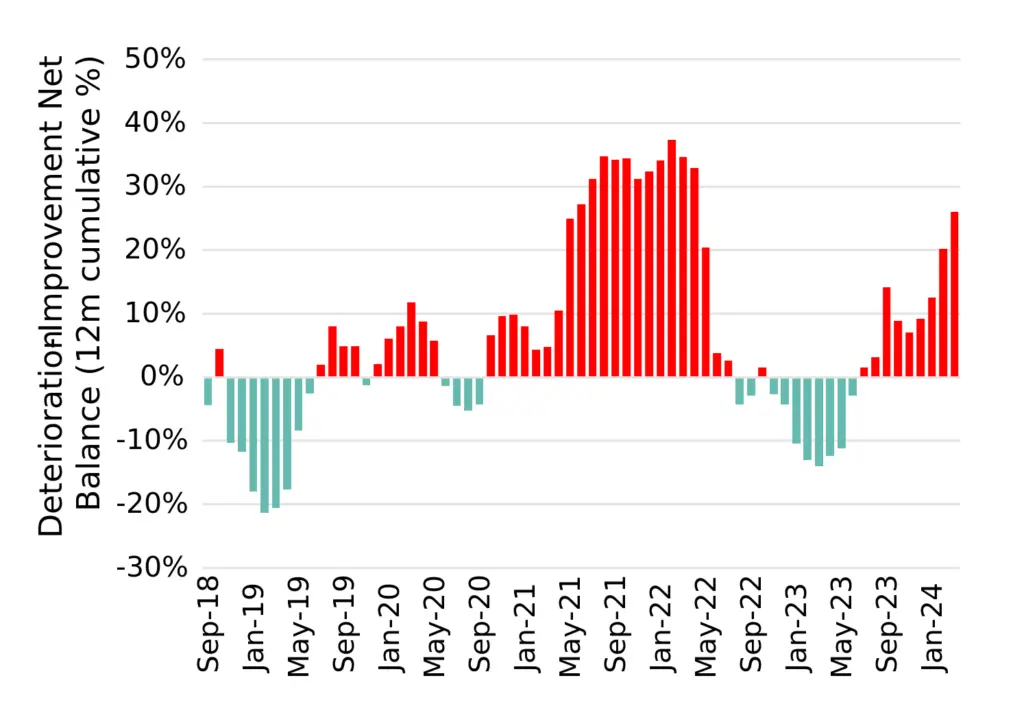
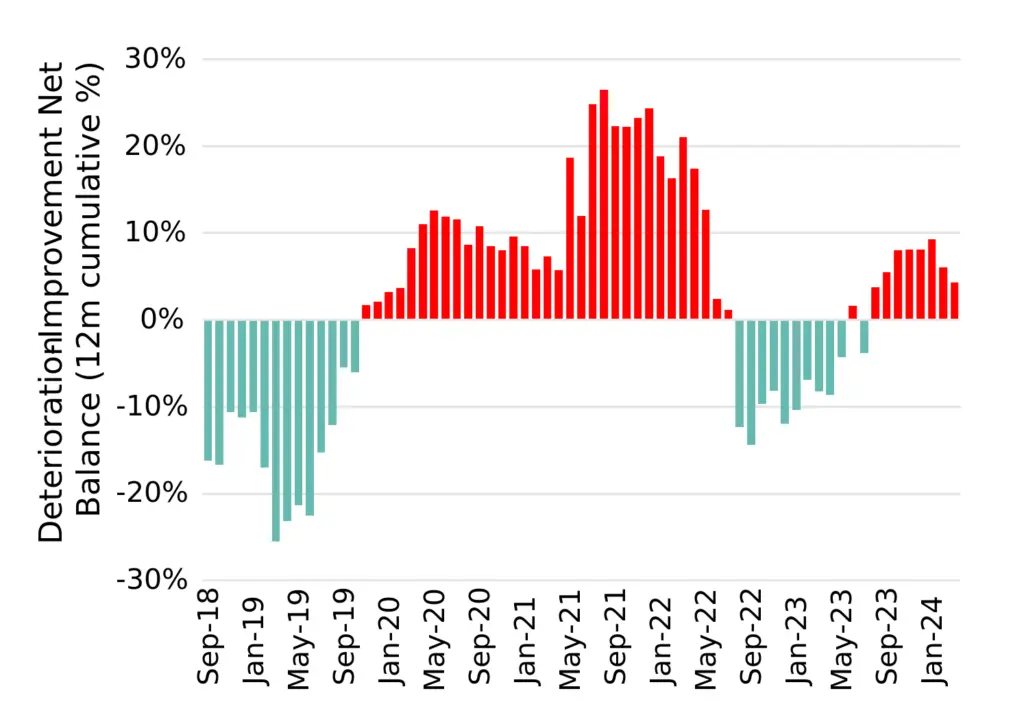
Deteriorations vs improvements % of total
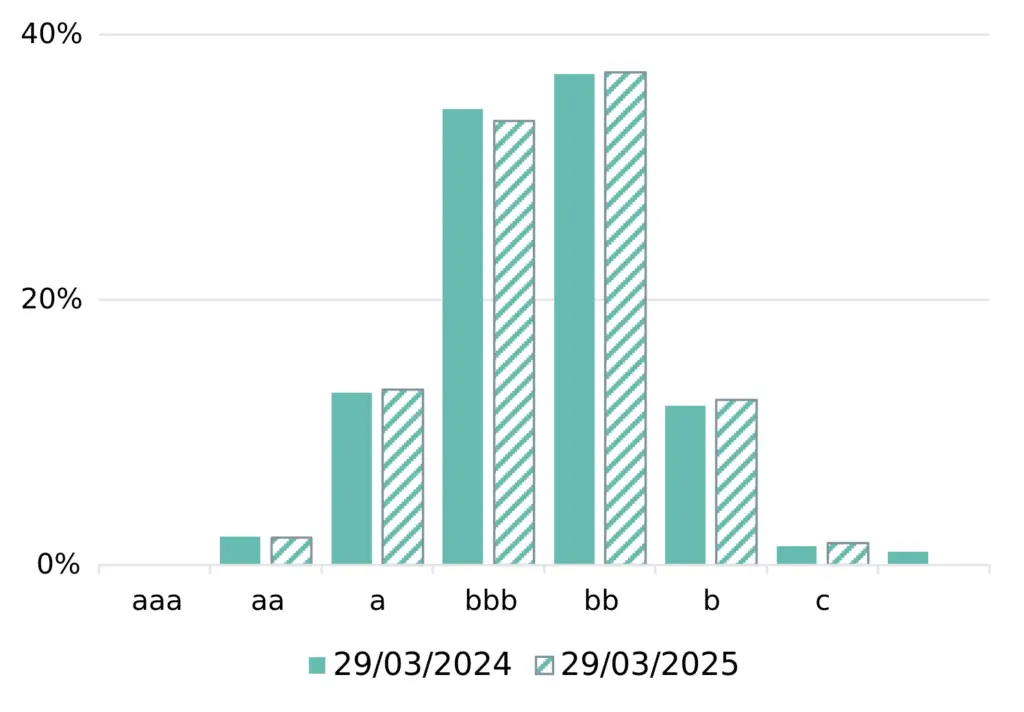
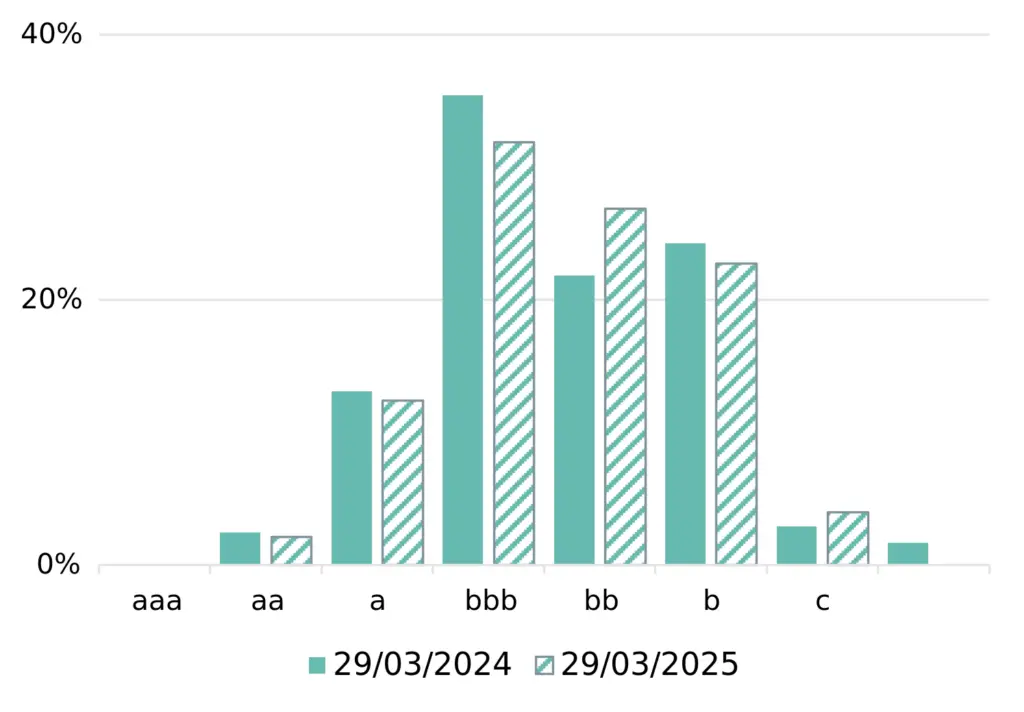
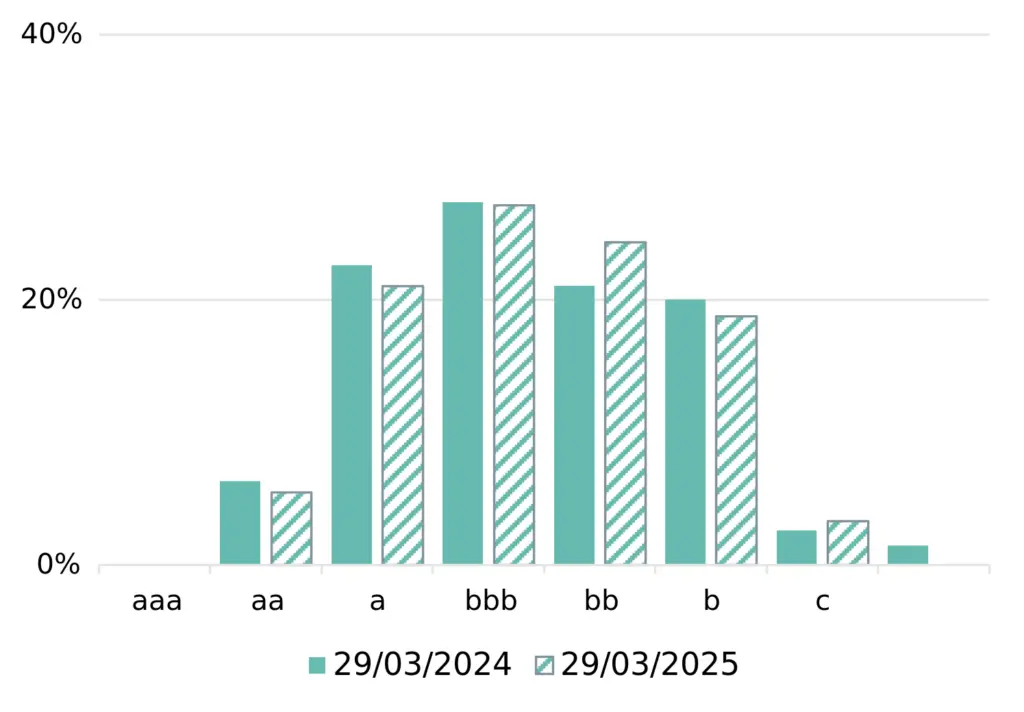
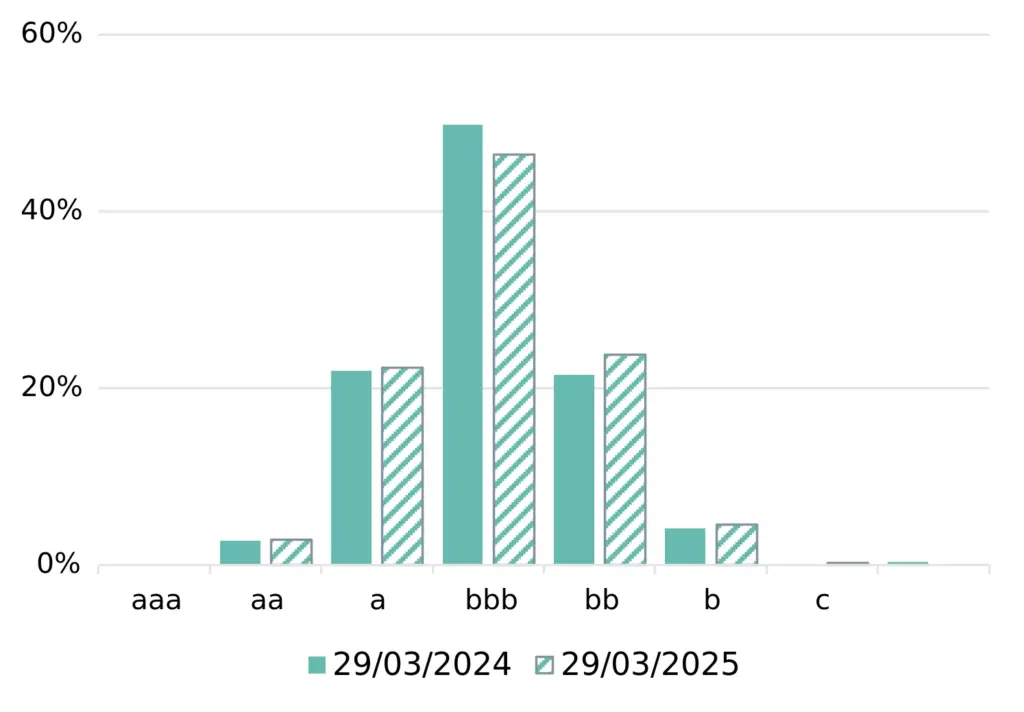
Distribution by rating category (%)
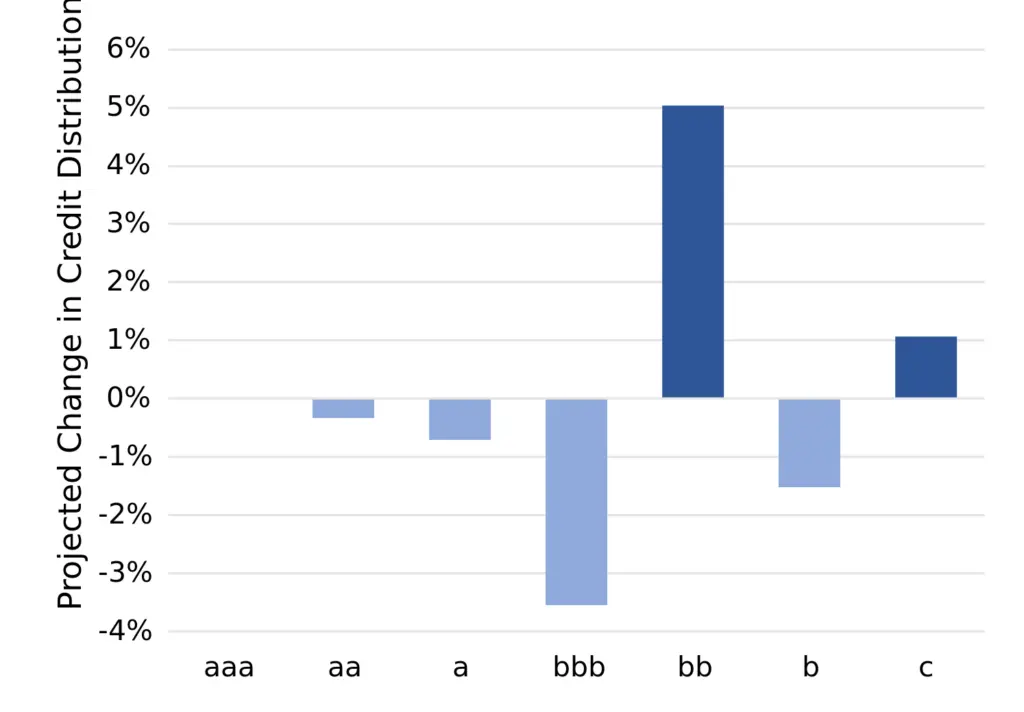
Distribution by rating category (%)
Key Takeaways
We predict EU Corporate default^risks to rise slightly in H2 2024 before dropping back to current levels in Q1 2025. A rise of as much as 7% is possible but there is a significant chance of a 12% drop.
Deteriorations currently outnumber Improvements, but the balance is likely to peak in Q4 24.
Credit migrations will be limited but we expect categories “bb” and “c” to increase, while “bb” and “b” to decrease. The “a” category is also likely to increase.
Our aggregated consensus ratings cover more than 3,400 EU non-financial Corporate obligors, 90% of which are not rated by a credit rating agency.
* Covering all corporate sectors, including those discussed in this report, but excluding financial institutions.
^ Default Risk is defined as a weighted average of S&P long-term observed default rates in each rating category, using the monthly sector credit breakdown as weights derived from contributed bank data.
Outlook for EU Financial Institutions
Expect return to improving trend in H2 2024; could fade in 2025 if rate cuts hit interest margins and insurance cycle softens
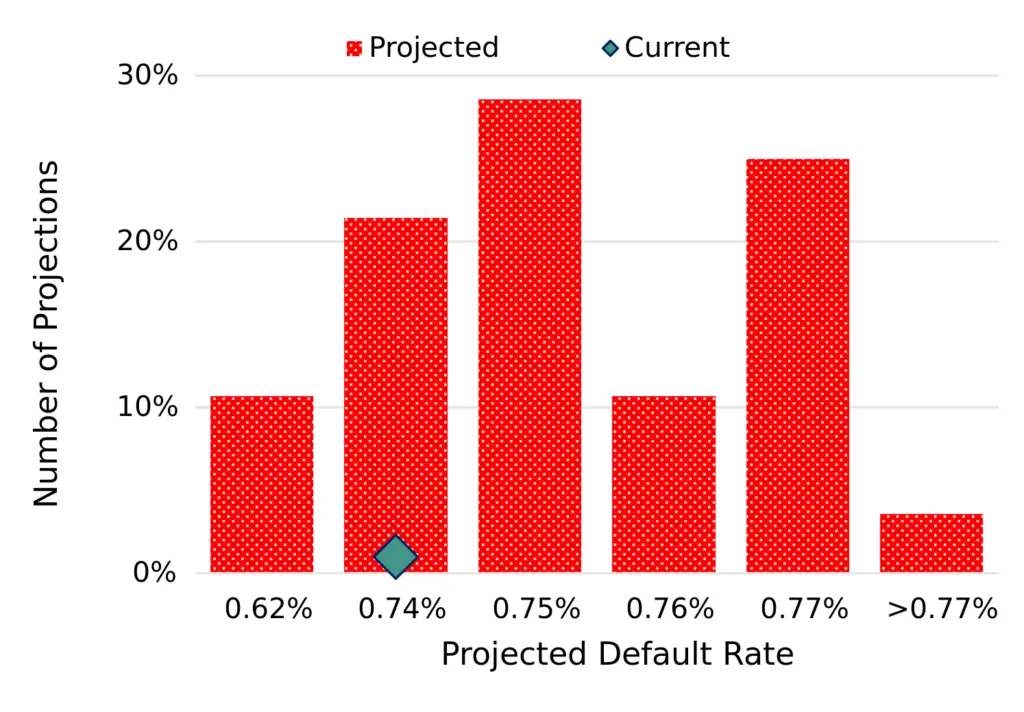
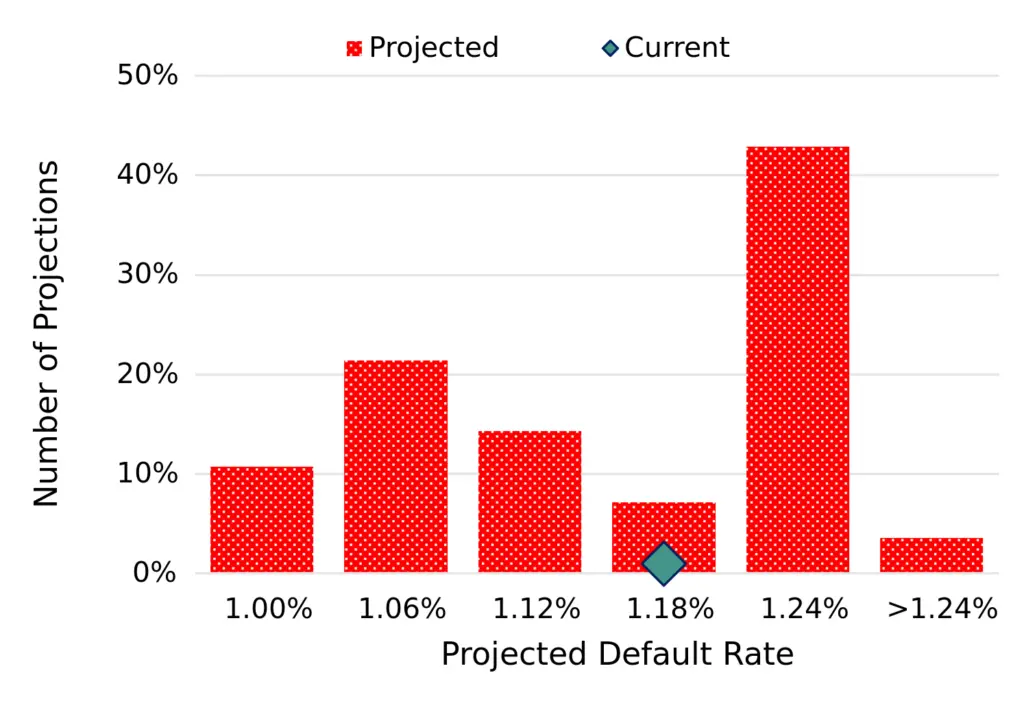
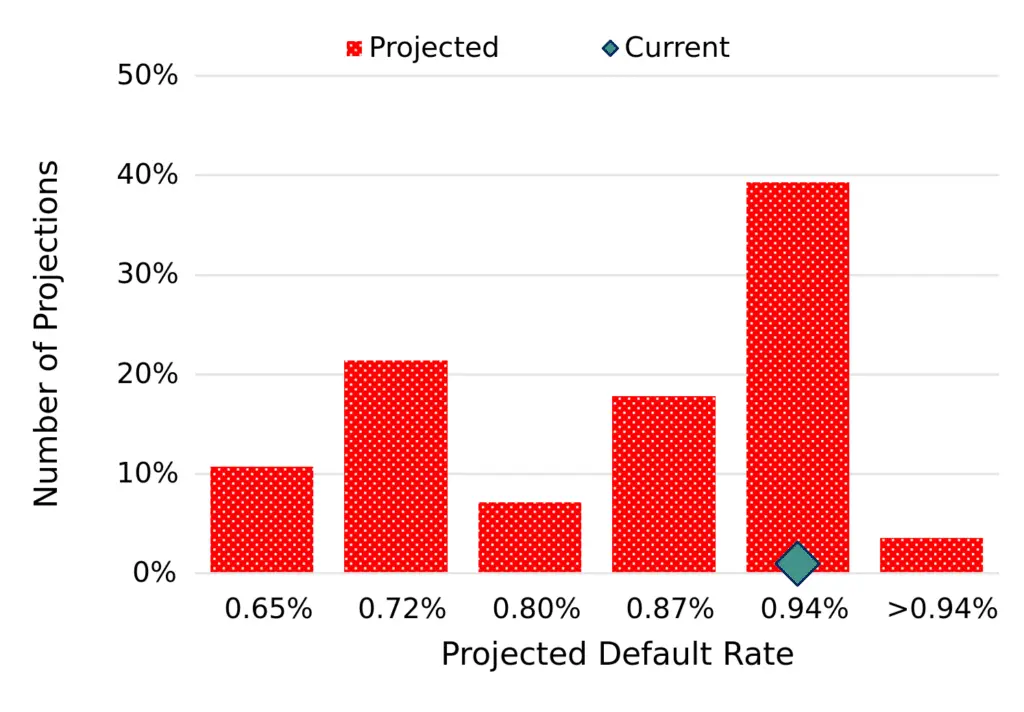
Projected 2024 default rate distribution
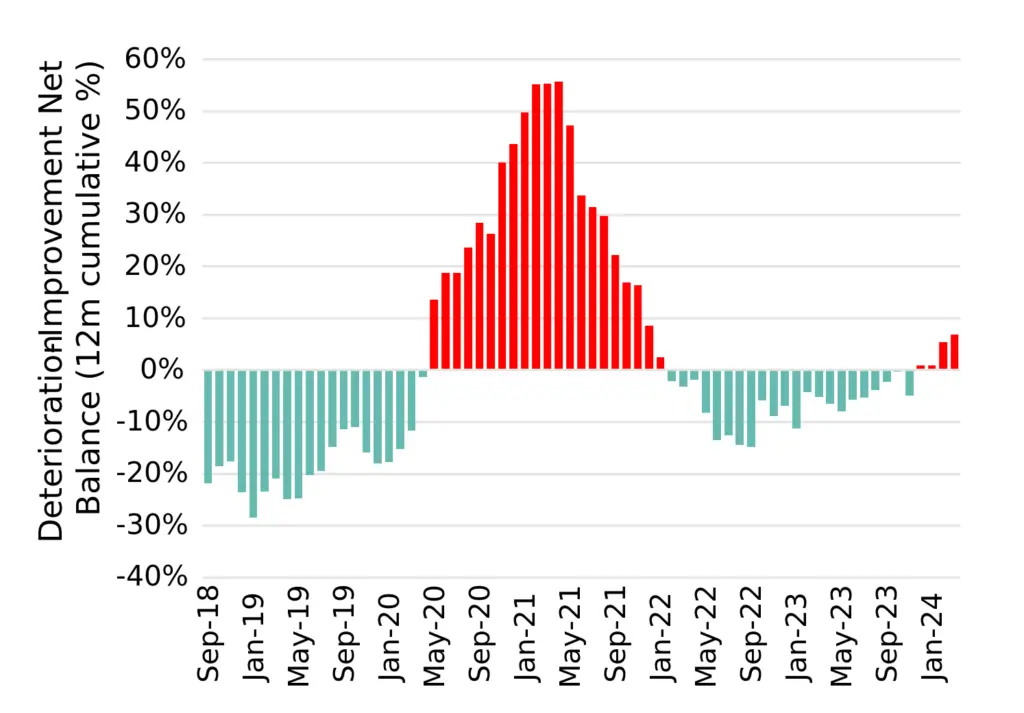
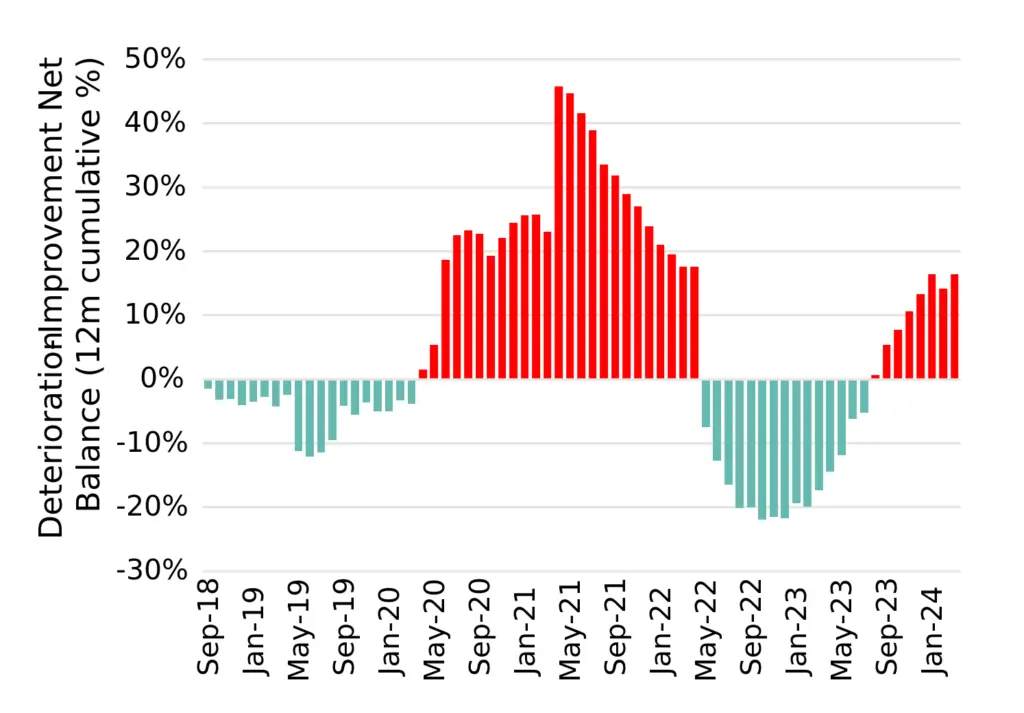
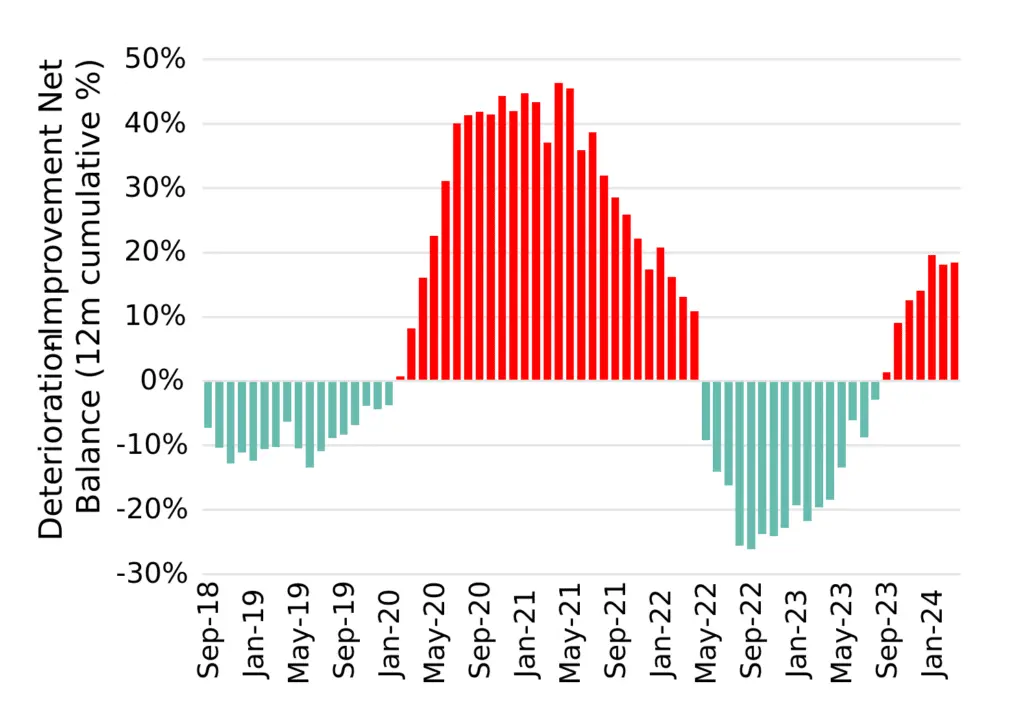
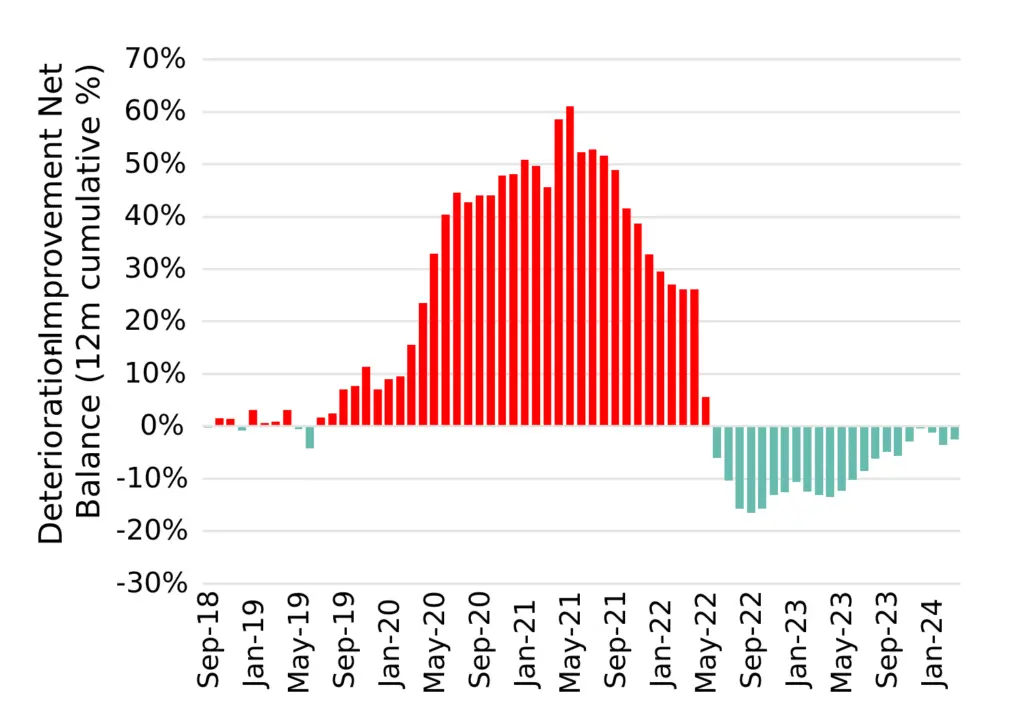
Deteriorations vs improvements % of total
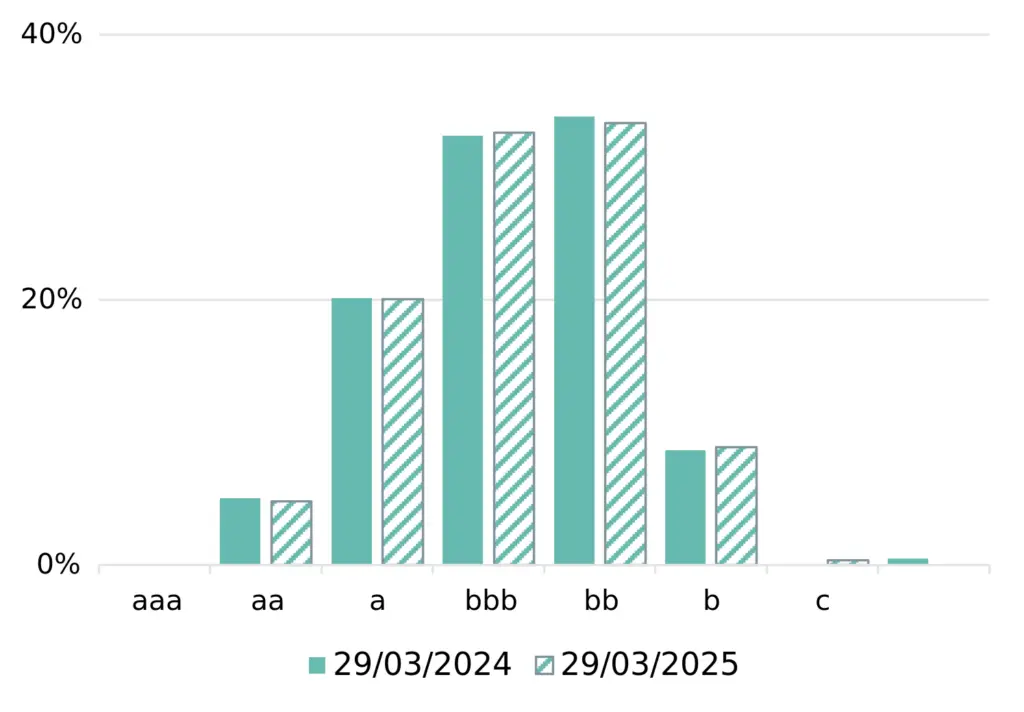
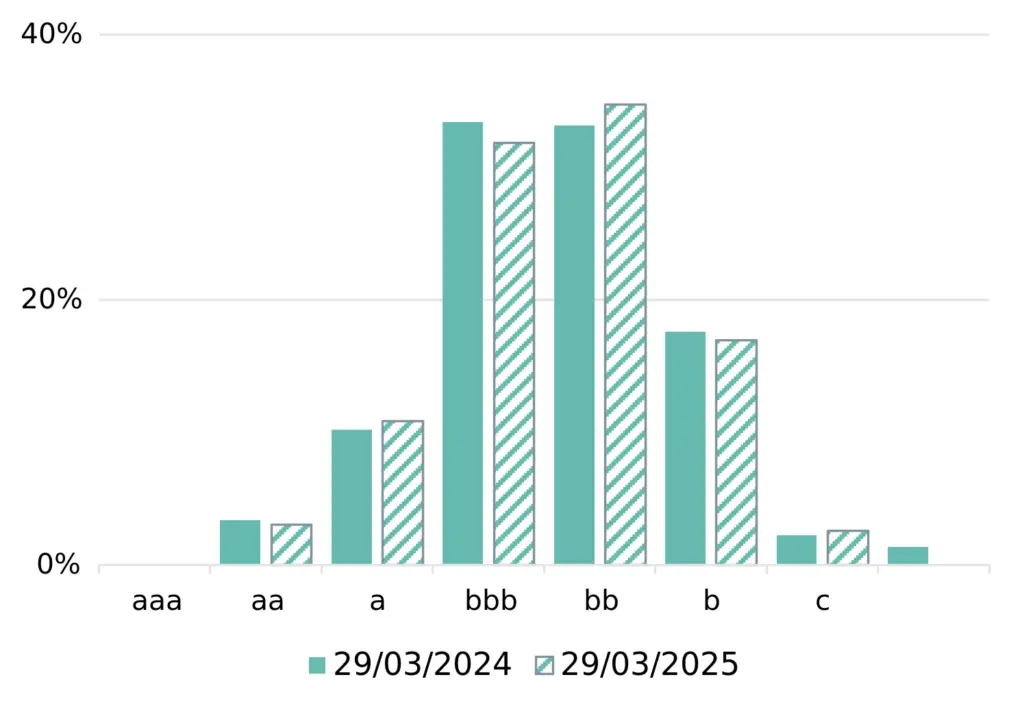
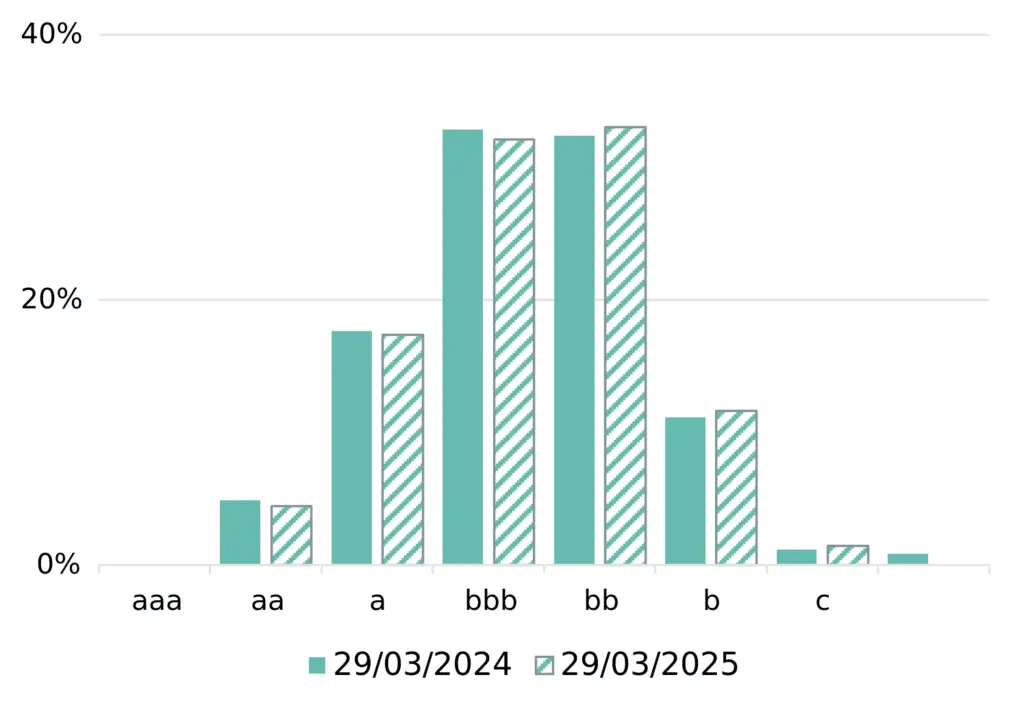
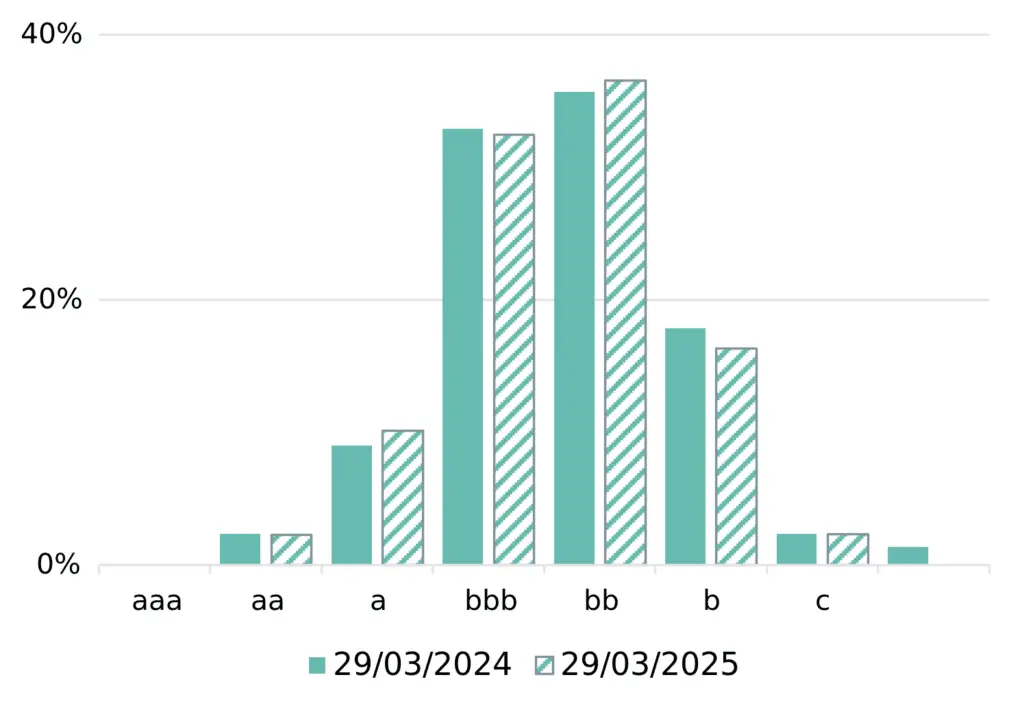
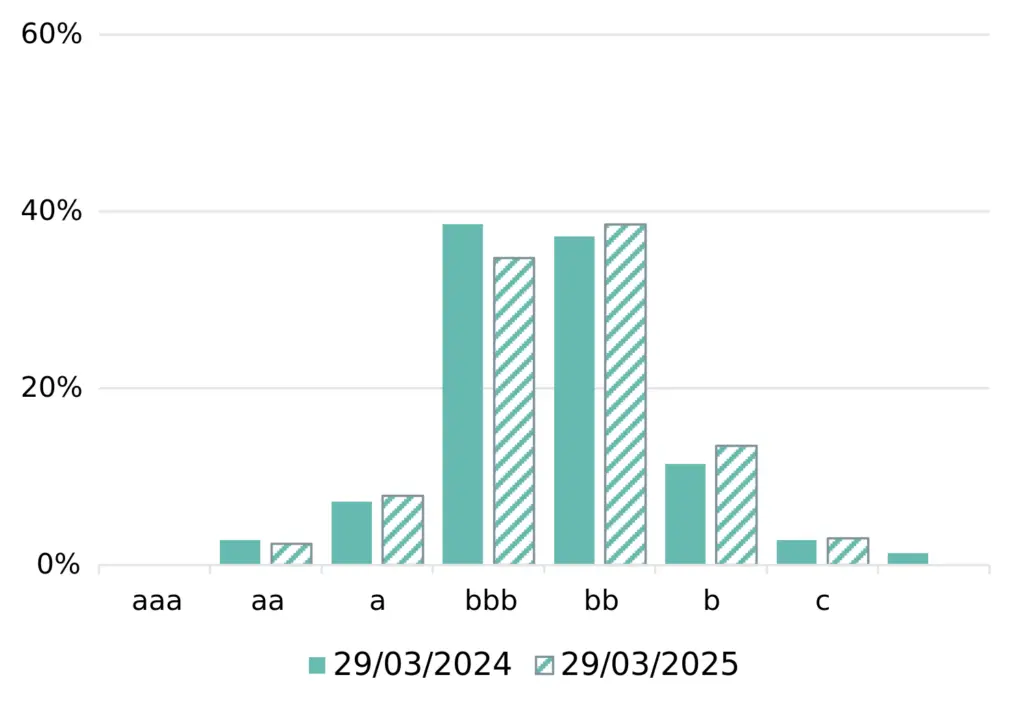
Distribution by rating category (%)
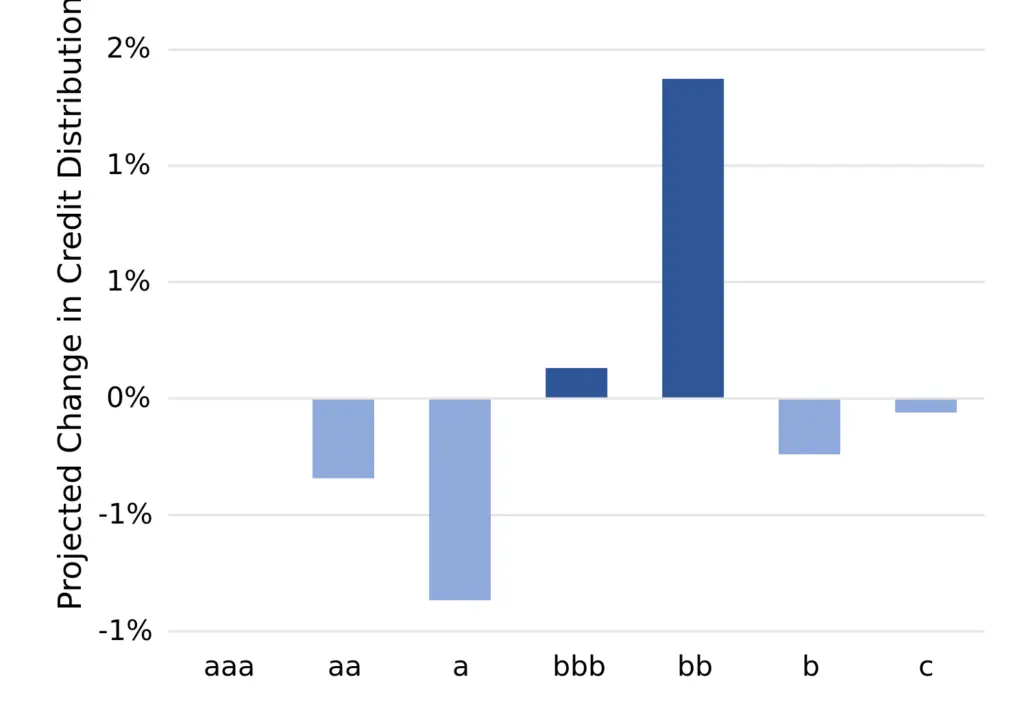
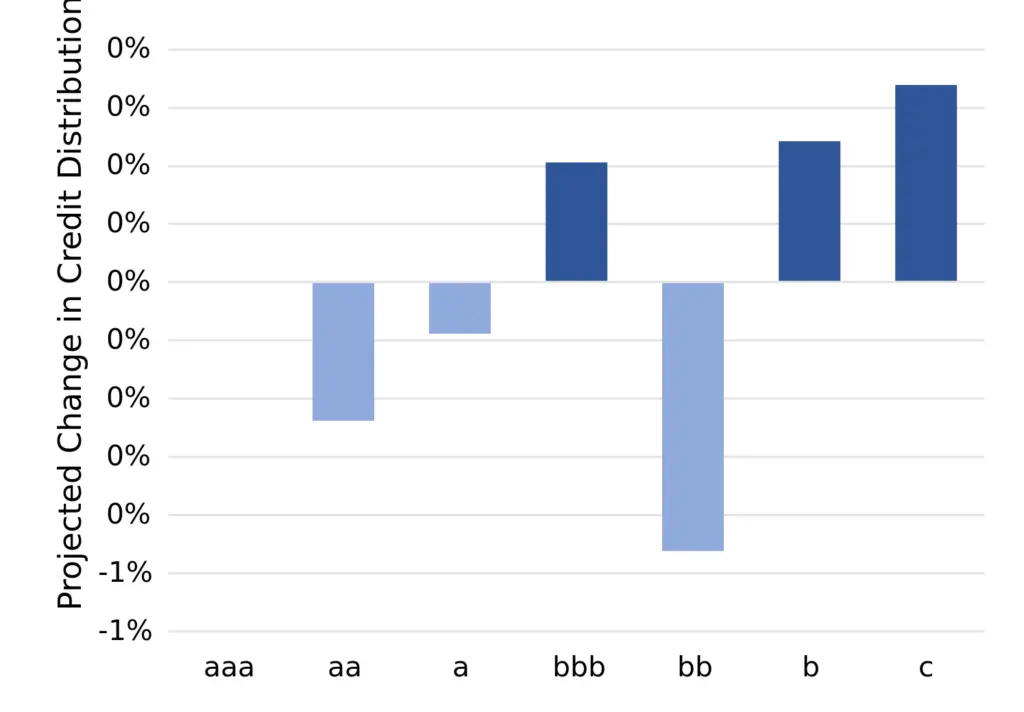
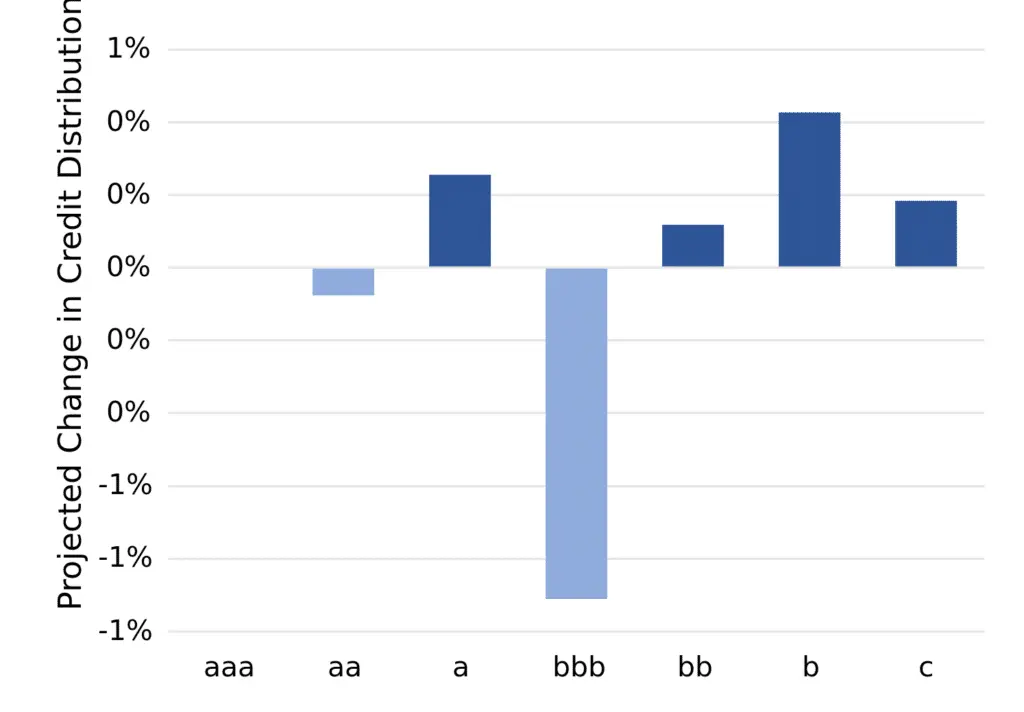
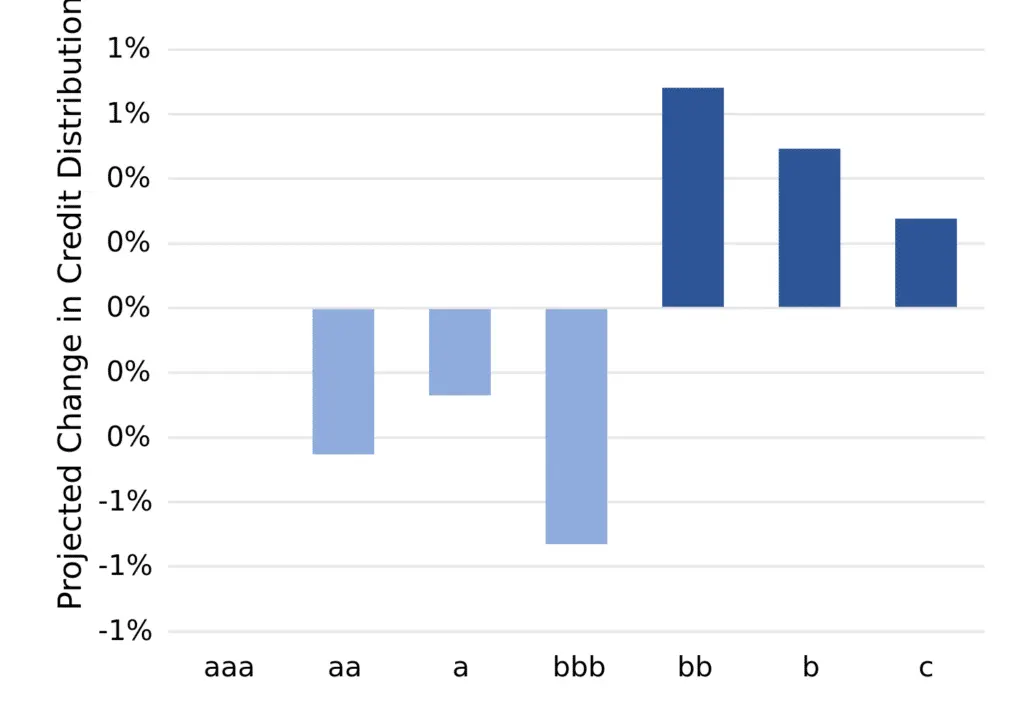
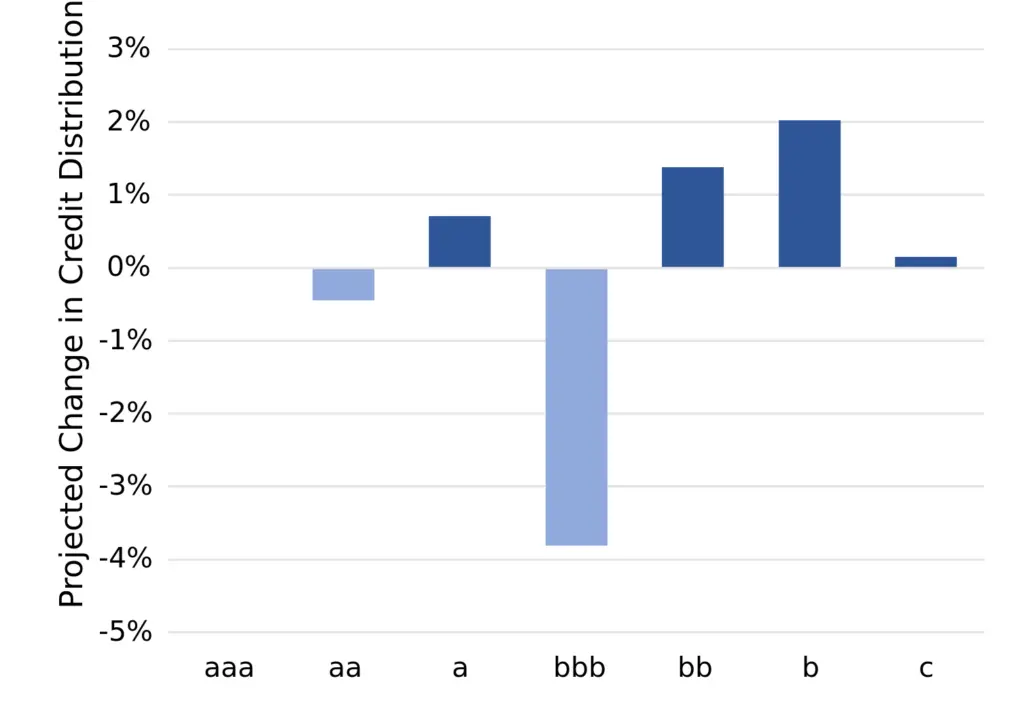
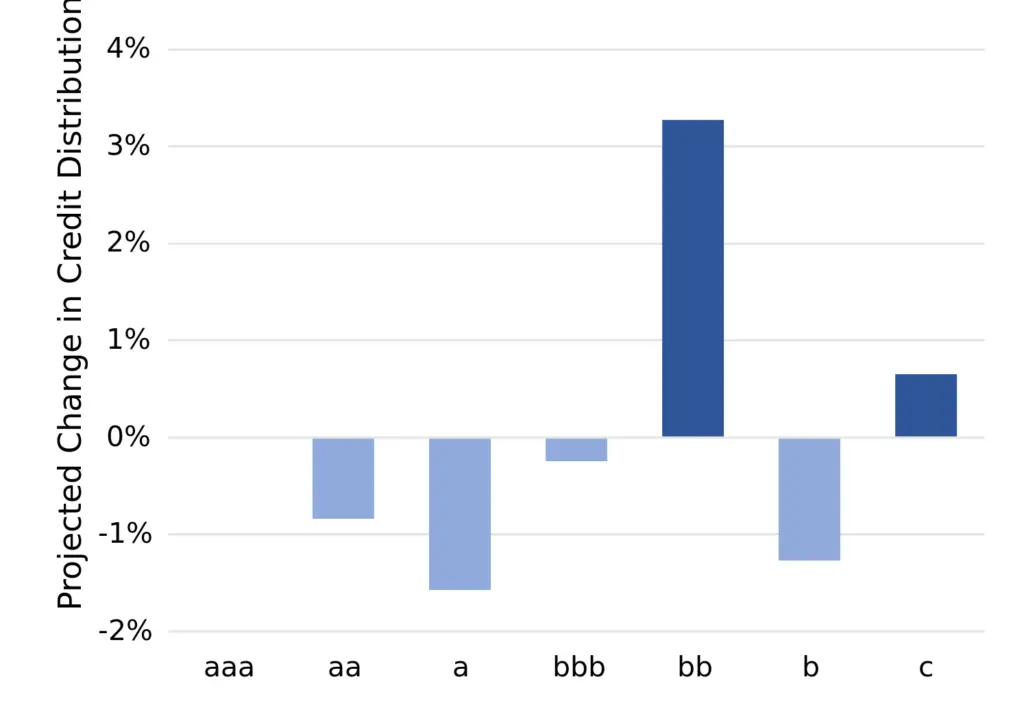
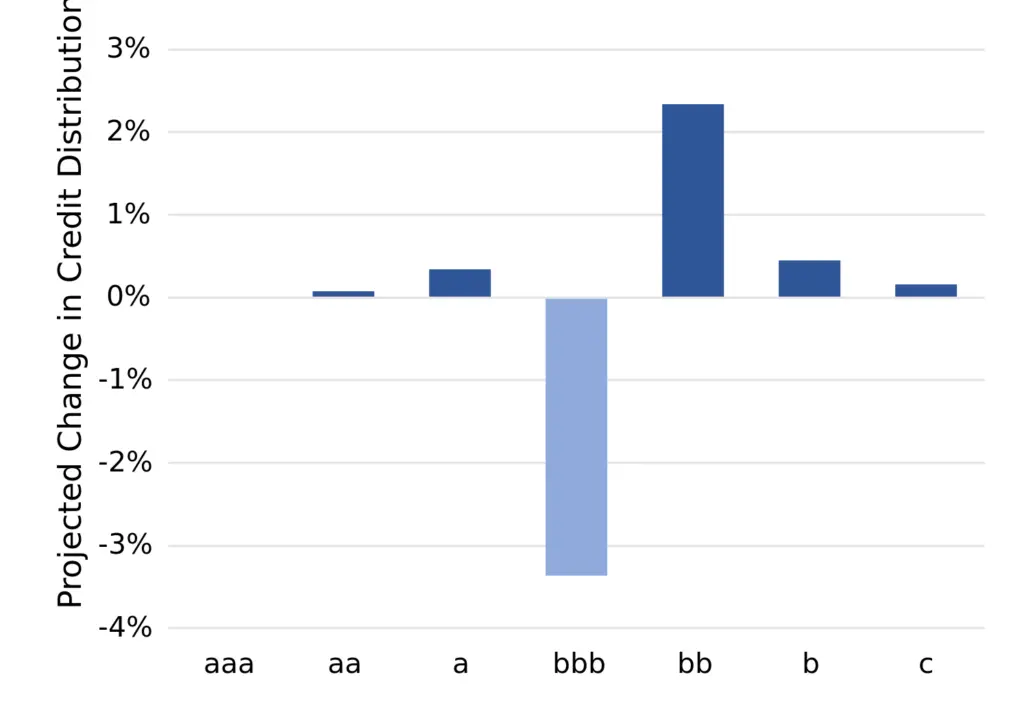
Projected change in credit distribution (%)
Key Takeaways
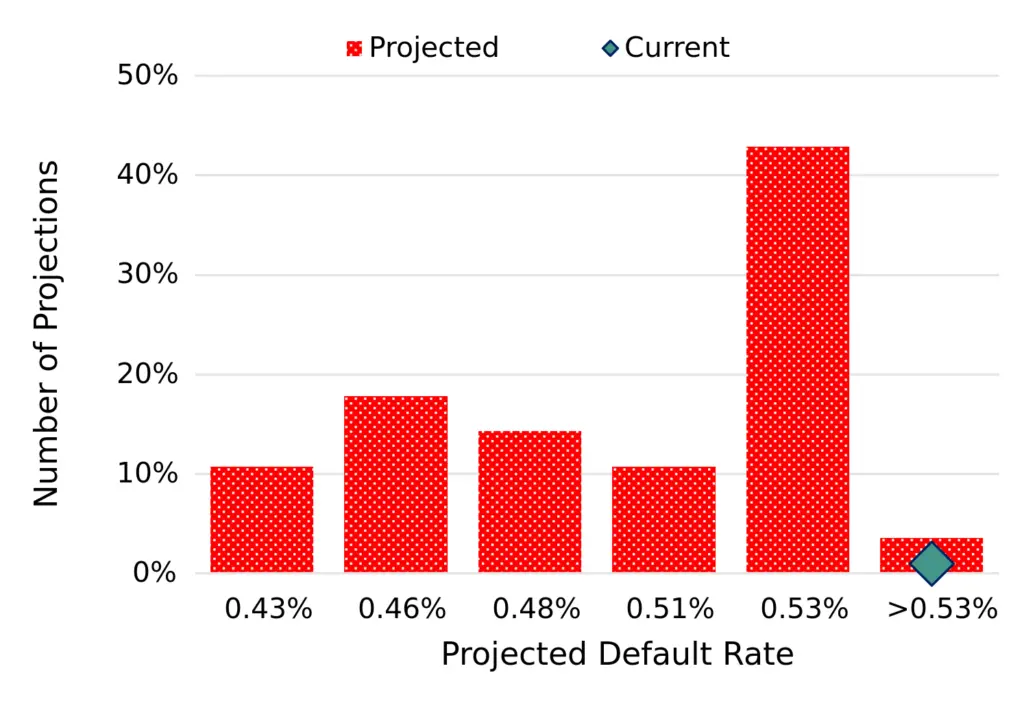
We predict EU Financials default^ risks to drop in H2 2024 but any improvement will fade into Q1 2025. Projections range from a drop of 3% to a drop of 21%.
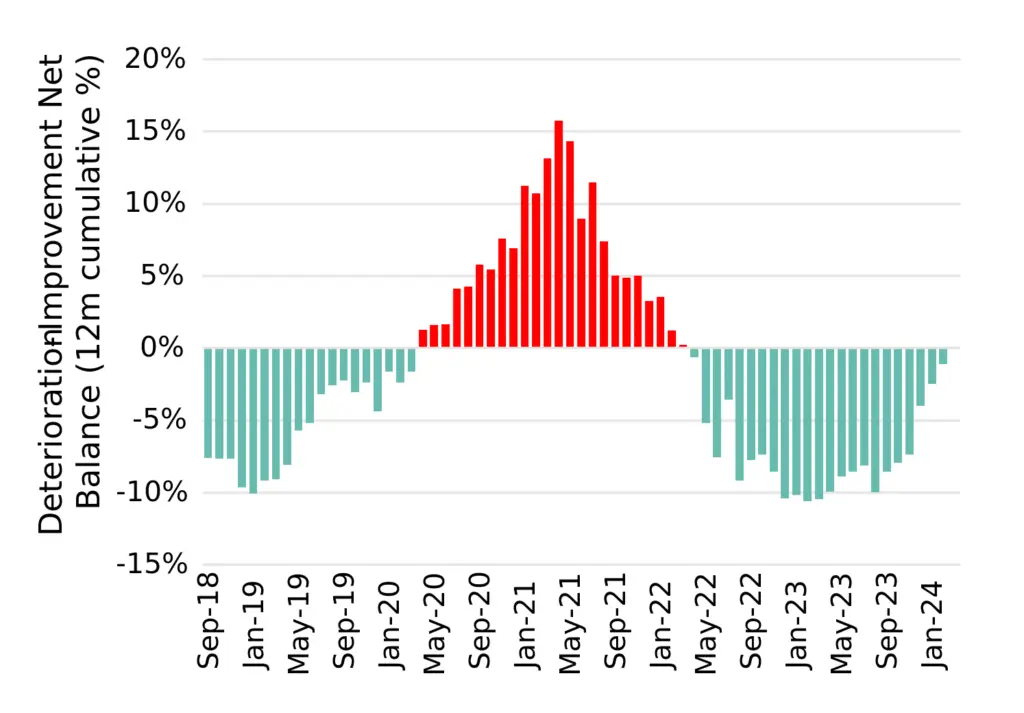
Improvements still narrowly outnumber Deteriorations, but the favourable balance is likely to peak in Q4 24.
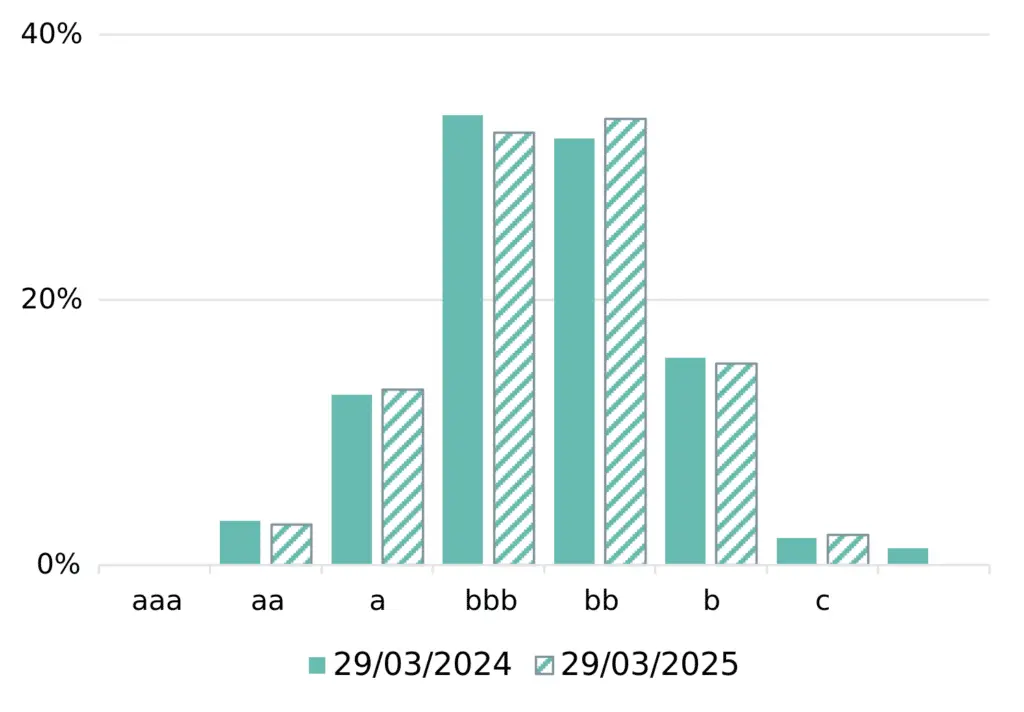
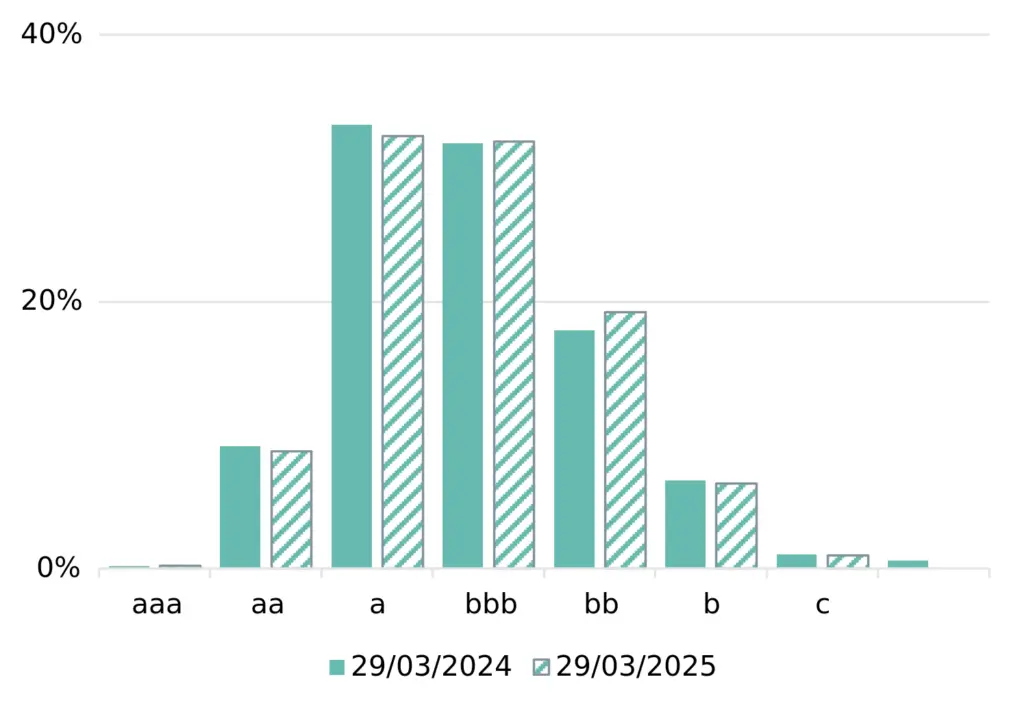
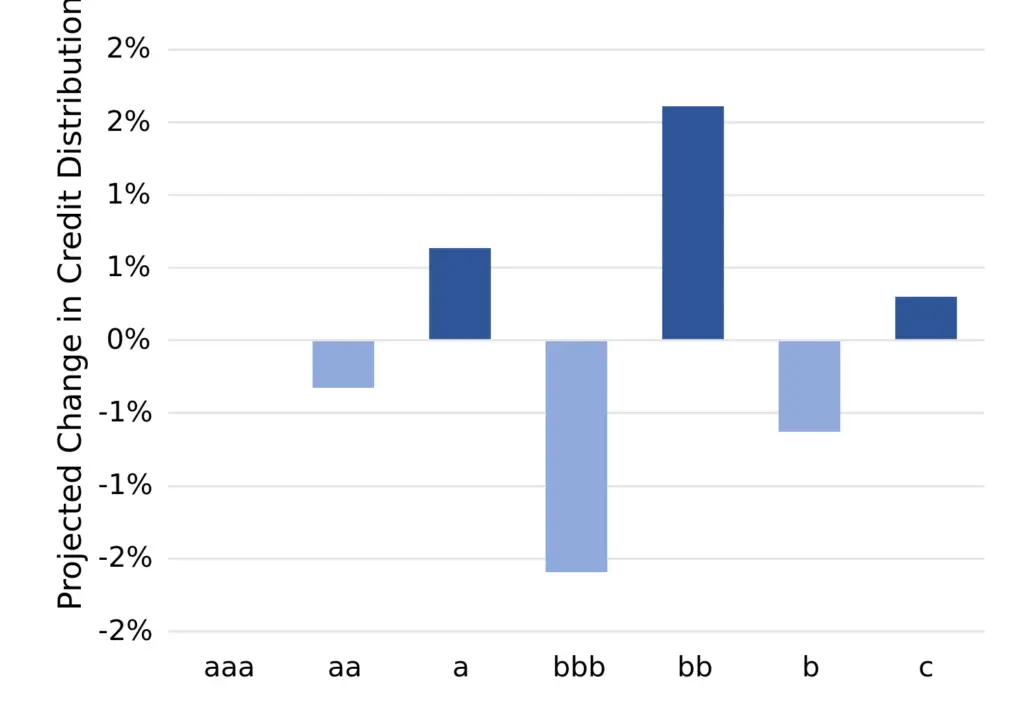
Credit migrations will be pulled to the centre of the credit distribution. We expect categories “bbb” and “bb” to increase, drawn from both IG and HY ends of the credit spectrum.
Our aggregated consensus ratings cover more than 1,355 EU Financial obligors, 75% of which are not rated by a credit rating agency.
^ Default Risk is defined as a weighted average of S&P long-term observed default rates in each rating category, using the monthly sector credit breakdown as weights derived from contributed bank data.
Outlook for EU Oil & Gas
Default Risk to rise in 2024/25; sector at risk of supply disruptions and shift to renewables
Projected 2024 default rate distribution
Deteriorations vs improvements % of total
Distribution by rating category (%)
Projected change in credit distribution (%)
Key Takeaways
We predict EU Oil & Gas default^ risks to rise significantly over the next 12 months but the outlook is increasingly volatile on geopolitical risks. There is a small chance that default risks drop but the central case of a 19% increase is close to the upper bound of a 23% increase.
Balance has shifted to Deteriorations and likely to climb over next 12 months; recent default rate index easing expected to reverse.
Credit migrations show modest downgrade shift. We expect categories “b” and particularly “c” to increase, driven by transitions from “bb” category.
Our aggregated consensus ratings cover more than 130 EU Oil & Gas obligors, 90% of which are not rated by a credit rating agency.
^ Default Risk is defined as a weighted average of S&P long-term observed default rates in each rating category, using the monthly sector credit breakdown as weights derived from contributed bank data.
Outlook for EU Industrials*
Default rates stable this year, could improve significantly early 2025
Projected 2024 default rate distribution
Deteriorations vs improvements % of total
Distribution by rating category (%)
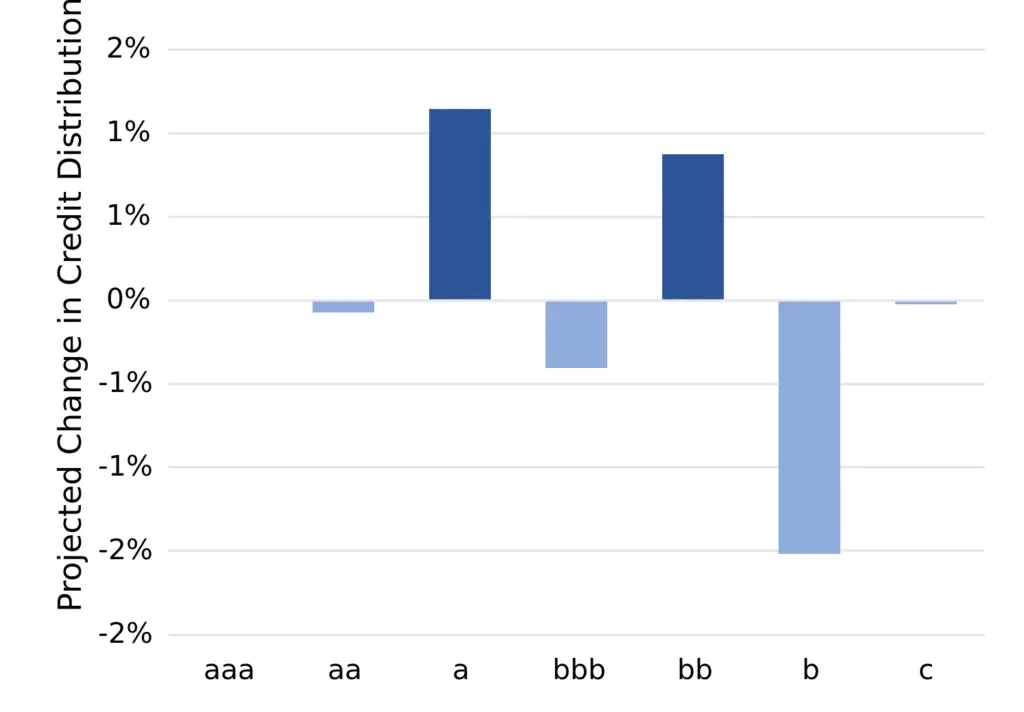
Projected change in credit distribution (%)
Key Takeaways
We predict EU Industrials default^ risks to show little change over the next 12 months but outlook is increasingly volatile on geopolitical risks. The expected range is biased to lower default rates, which may fall by as much as 15%.
Improvements are likely to overtake Deteriorations by Q4 2024; recent default rate index uptick is expected to stabilise.
Credit migrations are mixed. We expect the main shift to be from “bbb” and “b” to “bb”, and a small increase in “c” balanced by a larger increase in “a”.
Our aggregated consensus ratings cover more than 1,300 EU Industrial obligors, 92% of which are not rated by a credit rating agency.
* Covering the manufacture of industrial goods and services, e.g., constructions materials, aerospace, electronic equipment and components, defense equipment, railroads, marine transportation, industrial machinery, commercial vehicles and trucks, etc.
^ Default Risk is defined as a weighted average of S&P long-term observed default rates in each rating category, using the monthly sector credit breakdown as weights derived from contributed bank data.
Outlook for EU Basic Materials*
Credit cycle trends suggest risk of currently stable default rate rising significantly in mid/late 2025
Projected 2024 default rate distribution
Deteriorations vs improvements % of total
Distribution by rating category (%)
Projected change in credit distribution (%)
Key Takeaways
We predict EU Basic Materials to stay within a narrow range with only a slight increase in default^ risks over the next 12 months but significant deterioration is possible later next year.
Balance has shifted to Deteriorations and could significantly increase over next 12-18 months. Sector has a history of wide variations in this metric and in default rates.
Credit migrations show modest downgrade shift. We expect the “bbb” category to shrink slightly with transitions mainly to the High Yield categories.
Our aggregated consensus ratings cover about 370 EU Basic Materials obligors, 92% of which are not rated by a credit rating agency.
* Covering the mining industries for aluminum, iron, steel, coal, gold platinum and precious metals, non-ferrous metals, as well as forestry and paper products.
^ Default Risk is defined as a weighted average of S&P long-term observed default rates in each rating category, using the monthly sector credit breakdown as weights derived from contributed bank data.
Outlook for EU Consumer Goods
Consumer Goods expected to benefit from lower rates; scope for significant drop in default rates
Projected 2024 default rate distribution
Deteriorations vs improvements % of total
Distribution by rating category (%)
Projected change in credit distribution (%)
Key Takeaways
We predict EU Consumer Goods to show a slight improvement in default^ risks later this year and this could accelerate in H2 2025. There is a significant chance of lower default rates, down by as much as 25%.
Deteriorations currently outweigh Improvements, but the cycle is expected to turn more positive from Q1 2025 onwards.
Credit migrations show modest downgrade shift. We expect to see a modest shift from Investment Grade to the High Yield categories but this should stabilise by the end of 2024.
Our aggregated consensus ratings cover about 550 EU Consumer Goods obligors, 93% of which are not rated by a credit rating agency.
^ Default Risk is defined as a weighted average of S&P long-term observed default rates in each rating category, using the monthly sector credit breakdown as weights derived from contributed bank data.
Outlook for EU Consumer Services
Consumer Services at risk of modest deterioration in 2025 but optimistic scenario shows scope for significant improvement if rate cuts drive wider economic recovery
Projected 2024 default rate distribution
Deteriorations vs improvements % of total
Distribution by rating category (%)
Projected change in credit distribution (%)
Key Takeaways
We predict EU Consumer Services to show a slight increase in default ^ risk by early 2025. But there is a significant chance of a drop by as much as 30%.
Deteriorations and Improvements are currently in balance but there is a risk that the cycle turns decisively negative early next year.
Credit migrations show a positive bias for 2024. This is mainly driven by a drop in the “b” category and an increase in the “a” category. There has also been a trend decrease in the “c” category over the past 3 years; any reversal in this would lead to a spike in default rates.
Our aggregated consensus ratings cover about 510 EU Consumer Services obligors, 97% of which are not rated by a credit rating agency.
^ Default Risk is defined as a weighted average of S&P long-term observed default rates in each rating category, using the monthly sector credit breakdown as weights derived from contributed bank data.
Outlook for EU Technology
Significant credit deterioration with record deteriorations; EU Technology development lagging US
Projected 2024 default rate distribution
Deteriorations vs improvements % of total
Distribution by rating category (%)
Projected change in credit distribution (%)
Key Takeaways
We predict EU Technology to show a marked increase (+22%) in default ^ risks later this year although this should fade by early 2025. There is a small chance of a slight improvement, but the upper bound of the range implies an increase of 27% or more.
Deteriorations vs. Improvements are at their highest level for 5 years; but this negative cycle should have played out by mid 2025.
Credit migrations show a bias to downgrades. We expect to see a major shift from Investment Grade to the High Yield categories although the “b” category may drop as obligors transition to “c”.
Our aggregated consensus ratings cover about 175 EU Technology obligors, 88% of which are not rated by a credit rating agency.
^ Default Risk is defined as a weighted average of S&P long-term observed default rates in each rating category, using the monthly sector credit breakdown as weights derived from contributed bank data.
Outlook for EU Telecoms
Infrastructure overheads and interest burdens plus increased global satellite competition points to difficult credit outlook persisting in 2025
Projected 2024 default rate distribution
Deteriorations vs improvements % of total
Distribution by rating category (%)
Projected change in credit distribution (%)
Key Takeaways
We predict EU Telecoms to show a sizeable increase (+16%) in default ^ risks and this trend is expected to persist in 2025. The upper bound of the projected range suggests increases of more than 24%, with very little chance of any reduction.
Deteriorations vs. Improvements are at more than double the previous high over the past 5 years; and any improvement is likely to be slow.
Credit migrations are skewed towards downgrades. We expect about 3% of the sector to transition from “bbb” to “bb” and “b” categories.
Our aggregated consensus ratings cover about 67 EU Telecoms obligors, 65% of which are not rated by a credit rating agency.
^ Default Risk is defined as a weighted average of S&P long-term observed default rates in each rating category, using the monthly sector credit breakdown as weights derived from contributed bank data.
Outlook for EU Health Care
Demographics and AI benefits expected to drive growth and credit improvements
Projected 2024 default rate distribution
Deteriorations vs improvements % of total
Distribution by rating category (%)
Projected change in credit distribution (%)
Key Takeaways
We predict little change in default ^ risks for the EU Healthcare sector. The projection range is very narrow and shows no bias in either direction.
Deteriorations vs. Improvements are at a 2 year high but expected to drop in the next 12-18 months.
Credit migrations are skewed towards the “bb” category. While the “c” category shows a small increase, the “b” category is likely to shrink by more as some obligors upgrade.
Our aggregated consensus ratings cover about 155 EU Healthcare obligors, 90% of which are not rated by a credit rating agency.
^ Default Risk is defined as a weighted average of S&P long-term observed default rates in each rating category, using the monthly sector credit breakdown as weights derived from contributed bank data.
Outlook for EU Utilities
Significant increase due to interest burden and higher capex; but scope for 2025 improvement if ECB cuts rates
Projected 2024 default rate distribution
Deteriorations vs improvements % of total
Distribution by rating category (%)
Projected change in credit distribution (%)
Key Takeaways
We predict a significant increase (+22%) in default ^ risks in the EU Utilities sector. There is a small chance that exceeds 25%, and a modest chance of a drop; but range is heavily biased to an increase. This is partly because the recent drop in default risk is far below trend and could reverse.
Deteriorations outnumber Improvements; this could reverse soon but indicators for the EU Utilities sector are noticeably volatile; an extended cycle of capex-driven deterioration is possible before the balance moves clearly into an improvement phase.
Credit migrations are skewed towards High Yield. These are nearly all projected to move from the “bbb” category.
Our aggregated consensus ratings cover about 190 EU Utilities obligors, 75% of which are not rated by a credit rating agency.
^ Default Risk is defined as a weighted average of S&P long-term observed default rates in each rating category, using the monthly sector credit breakdown as weights derived from contributed bank data.
Download PDF
Please complete your details to download the PDF of this report:
The historic data set that we used for our projections is based only on derived metrics from one-year ex ante probability of default (“PD”) estimates contributed by major global banks to Credit Benchmark. No external micro- or macro-level data was used.
The reported “Default Rate” is defined as a weighted average of S&P’s long-term observed default rates in each of the seven main rating categories (from “aaa” down to “c”), using the monthly sector credit breakdown as weights derived from contributed bank data.
This gives an index of default risk combined across investment-grade and high-yield borrowers, and this index only changes when contributing banks amend the credit classification of borrowers. It is therefore directly linked to changes in transition rates, which can be tracked and potentially predicted via the deterioration vs improvement net balance, which records ALL movements in single-name PDs across all rating categories.
Our projections are a combination of three types:
The proportion of sector borrowers projected to be in the “c” category by Q1 2025. The majority of defaulting borrowers will transition from this category.
The rolling 12m net balance of deteriorations vs improvements (“DIN”) across all credit categories in each sector, projected to the end of Q1 2025. This is used to weight peak and trough transition matrices as a function of the sector credit cycle phase.
The modelled default rate projected directly to end Q1 2025.
All projection types use multiple historic periods to give a range of future possible outcomes. Many of these give similar results, but some project large outliers in either tail of the distribution.
Reported ranges cover the 10th to 90th percentiles, and the central case is based on the 50th percentile.