
December 2017
Retail Industry Trends
“The number of people visiting U.S. stores on Thanksgiving and Black Friday fell 4% from last year, according to RetailNext Inc., which analyzes in-store videos to count shoppers. Meanwhile, online sales increased 18% over that period, said software company Adobe Systems Inc., a shift that is forcing traditional retailers to adopt new tactics.” – Wall Street Journal, Nov. 26 2017
Download the PDF “Retail Industry Trends”
This report uses bank-sourced data to track recent credit risk trends in the Global and US Retail Industry Trends. The data covers 389 US Retail sector players, including those without stock market listings or without ratings from major agencies.
This dataset provides transparency for global, regional, corporate hierarchy and individual legal entity factors. It can also be used to estimate a range of metrics which track monthly changes in the position and shape of the distribution of bank credit risk estimates.
The dataset provides an independent dimension for sector credit analysis as well as for detailed comparisons with fundamental and macro- factors.
This report provides a detailed analysis of recent credit trends in the US Retail sector. It also shows the current credit status of the Global Retail sector, in both cases using data contributed by global IRB and CCAR-regulated banks.
The Global Retail sector is subject to a number of conflicting influences. The global “middle class” now represents nearly half of the global population. The associated rising disposable income and increased discretionary spending is good news for retailers in the developing nations, which have seen steady growth in new shopping malls1 .
The position is very different in developed nations. One common view is that the suburban middle class are being squeezed; that elderly rural populations have a decreasing propensity to consume; and that young urban millennials who face high accommodation costs now value experiences over possessions.
For all groups, online shopping provides a cheaper and more convenient alternative to traditional bricks and mortar outlets. This “Amazon effect” is a major factor: e-commerce is growing at annual rates of 10% – 20% depending on the segment; traditional retail growth is barely keeping up with GDP, at around 1.5%. E-commerce is having a significant impact on malls and department stores. US Retail store closures have been running at double the rate of openings, even though consumer confidence remains high. Somewhere between a quarter and a half of all US shopping malls are expected to close over the next five years.
The credit worthiness of traditional retailer chains has also been impacted as a result of high self-imposed debt burdens to support over-expansion of physical stores in the past two decades. Additionally, over the last several years, private equity firms have significantly increased the amount of leveraged buyouts of traditional retailers. These rising debt levels will soon be subject to rising refinancing rates.
The combined impact of these factors has been called a “Retail Apocalypse”.
Credit Benchmark aggregates and anonymizes 1-year forward-looking through-the-cycle Probabilities of Default (“PD”) at the individual obligor level, based on the views of a growing number of global IRB and CCAR-regulated banks. The dataset is updated and published monthly. Exhibit 1.1 shows the current coverage.
Exhibit 1.1.1 Global Coverage
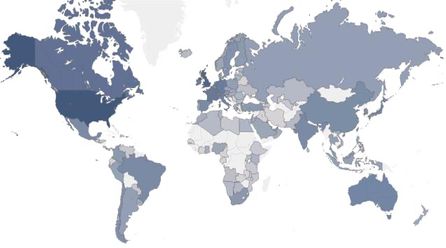
Exhibit 1.1.2 Dataset Growth
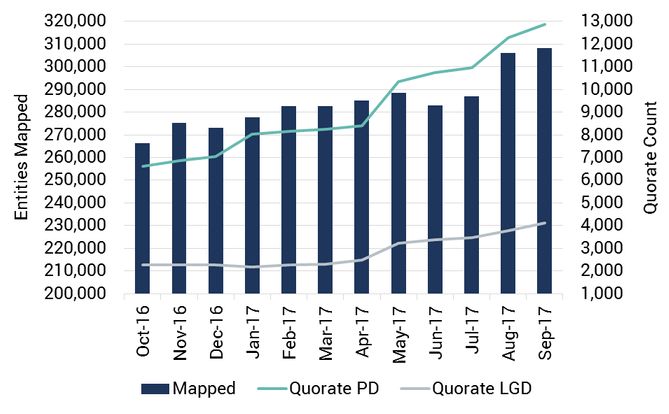

As of December 2017, consensus quorate2 estimates are available on 13,000 obligors including sovereigns, corporates, banks, funds and non-bank financial entities, spanning multiple geographies and entity sizes. The dataset also includes close to 300,000 additional mapped entities that can be leveraged to produce top-down portfolio views, indices and transition matrices.
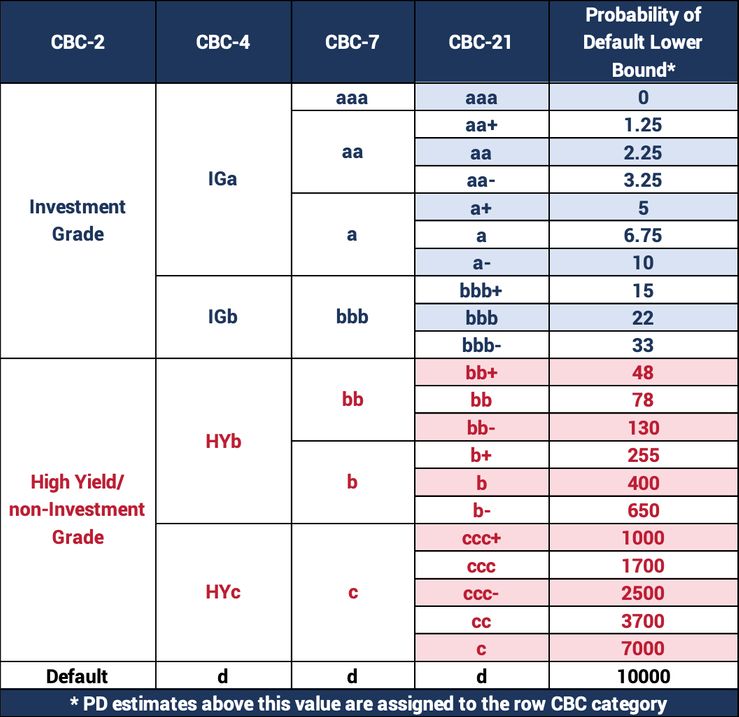
The single name estimates represent the consensus of the collective views of credit risk from experts in global banks. This approach leverages the Diversity Prediction Theorem3 , with single PD estimates aggregated and mapped to the Credit Benchmark Consensus (“CBC”) category scale.4
This section compares credit risk trends for quorate and semi-quorate5 large general retailers in three regions: US, UK and Western Europe6 .
Since the 1970s, US retail mall expansion has been four times higher than the population growth rate.7 This has resulted in a very competitive environment, and has left the sector vulnerable to the new challenges of online shopping and a shrinking middle class.
The UK currently faces specific retail issues: retail sales have been depressed by rapid food price inflation, and wavering consumer confidence. Data from credit-card provider Visa shows that traditional face-to-face retail sales in the UK are affected much more than e-commerce.8 Traditional retail sales have shown sluggish growth over the last three years, turning negative last year. UK e-commerce sales are growing steadily at around 5%.
Online shopping has had an impact in other European countries. For example, Zalando (the German version of Amazon), reported sales growth of 25% in Q3 2017 alone.9 Traditional German retailing has so far handled the challenge well; stronger consumer confidence and innovative retail experiences have slowed the penetration of e-commerce.
Exhibit 2.1 plots retail square footage per-capita for seven major economies, taken from the 2015 Cowan Research study.
Exhibit 2.1 Retail Square Footage per Capita
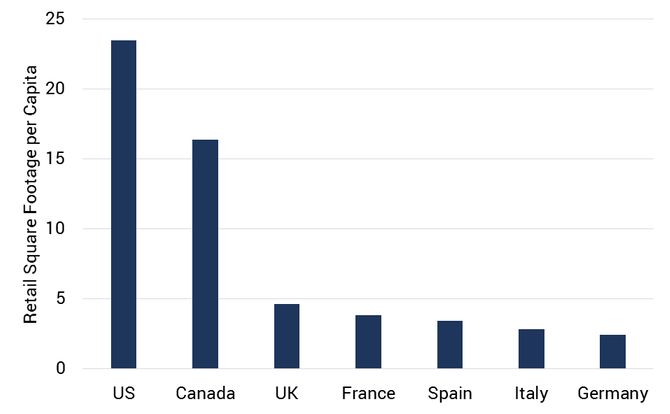
This shows, for example, that per-capita retail square footage in the US is ten times higher than in Germany.
The following analysis summarizes the banks’ view on credit risk in the Retail sector.
Exhibit 2.2 shows credit quality trends and distributions in the Retail sector for the US, the UK and Western Europe (ex-UK).
Exhibit 2.2 Credit Risk in the US, the UK and Western Europe (ex-UK)
Exhibit 2.2.1 Credit Risk Trends
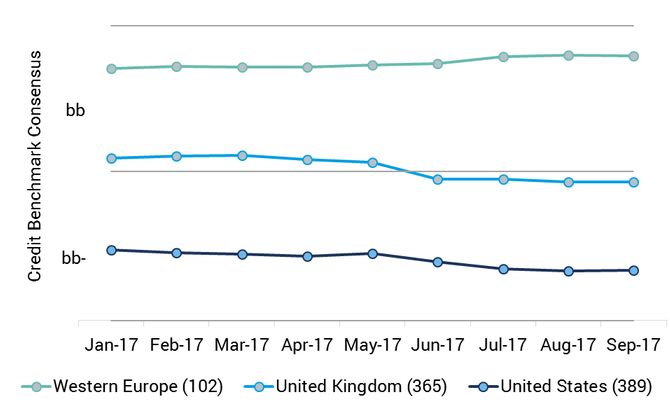
Exhibit 2.2.2 Credit Risk Distributions
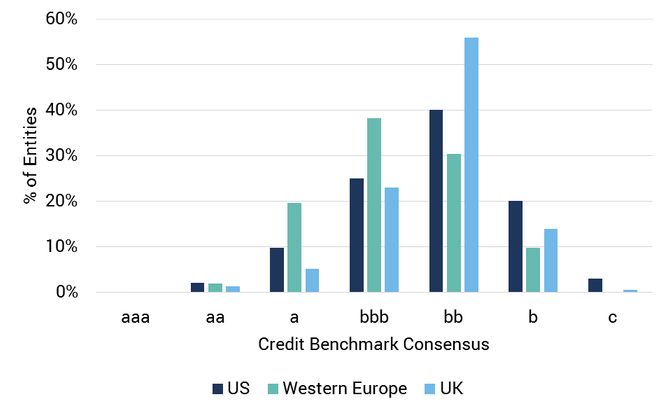
Exhibit 2.2.1 shows that US Retail credit quality is the lowest of these three groups, and Western Europe is the highest. There is a trend towards increasing credit risk in the US and the UK, rising by almost 10% over the last nine months. Western Europe (ex-UK), by contrast, shows a decrease.
Exhibit 2.2.2 analyses credit risk distribution of entities in the different regions. This shows that most of the Western European borrowers are in the bbb category, while both the UK and the US show a peak in the bb category. The dispersion of borrowers across the credit categories is significantly higher for US borrowers than for the UK entities.
Exhibit 2.3 charts the distribution of borrowers across Retail segments.
Exhibit 2.3 Index Composition
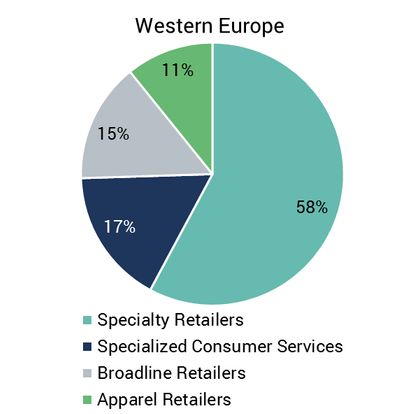
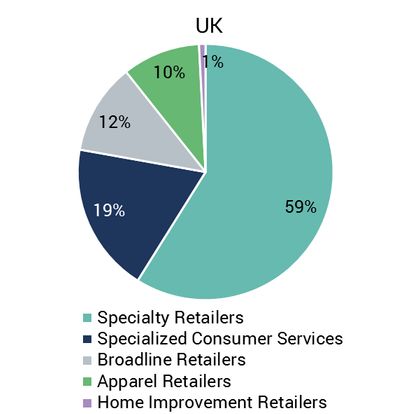
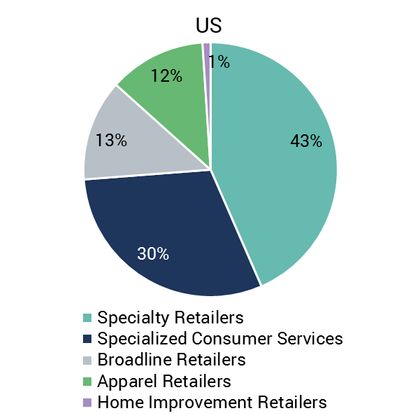
Exhibit 2.3 charts the distribution of borrowers across Retail segments. This shows that the distribution is comparable across the three regions.
There are some key trends recently impacting the Retail Industry Trends in the US. Prolonged low interest rates have encouraged debt-led expansion, contributing to market oversaturation. The popularity of online shopping is increasing (currently representing 9% of overall retail sales) 10 and traditional brick and mortar retail outlets are also suffering from an increasingly squeezed middle class.
Despite negative headlines, retail sales have been growing in recent years; the sales during the first six months of 2016 increased by $110bn compared to the same time period last year. 11 However, research by IHL Group shows that there are significant differences between segments. Sales in Furniture, Cosmetics, Mass Merchants and Dollar Stores are growing, while sales in Department stores, Sporting goods, Clothes, Shoes and Electronics are decreasing. Department stores in particular are struggling, with store closures outnumbering openings.
Our analysis consists of almost 400 quorate and semi-quorate large US General Retailers, mainly focused on Specialty Retailers, Specialized Consumers Services, Broadline Retailers and Apparel Retailers.
Exhibits 3.1 and 3.2 show the distribution and notch changes of the analyzed entities.
Exhibit 3.1 Distribution of Constituents
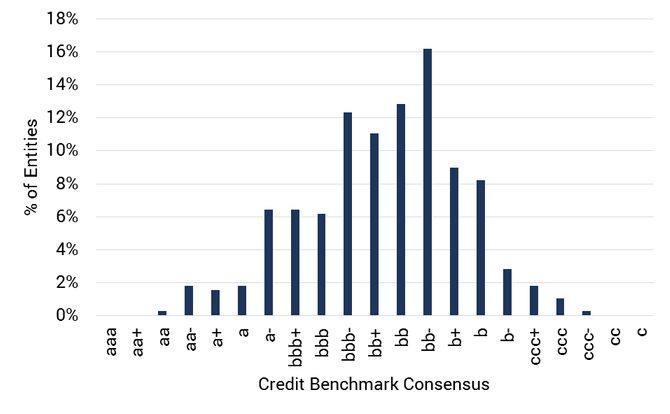
Exhibit 3.2 Analysis of Upgrades and Downgrades
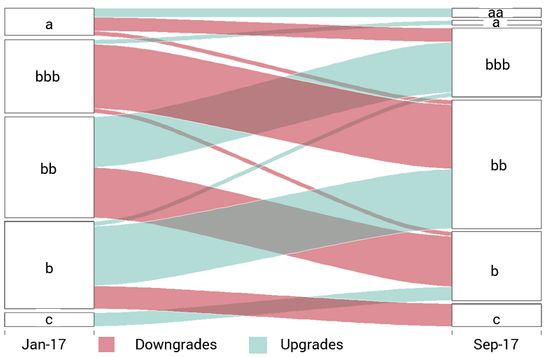
Exhibit 3.1 indicates that the US General Retailers are concentrated in the bb credit categories. Over the last 9 months, 21% of these companies were upgraded or downgraded. The bb category showed the smallest percentage (14%) of notch changes. The c category showed the largest percentage (25%) of notch changes.
Exhibit 3.2 shows that most of the downgrades occurred between the bbb and bb category. For non-investment grade, upgrades dominate.
Exhibit 3.3 shows the composition of the US Retail index analyzed in this paper, and Exhibit 3.4 shows credit trends in various US Retail segments.
Exhibit 3.3 US Retail Index Composition
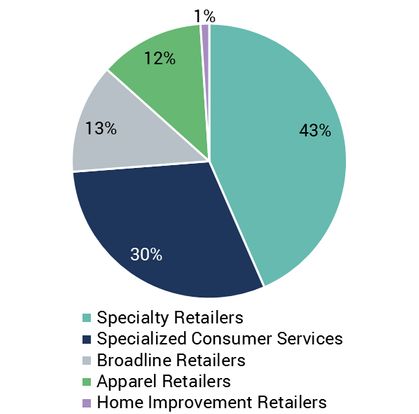
Exhibit 3.4 Credit Trends in US Retail
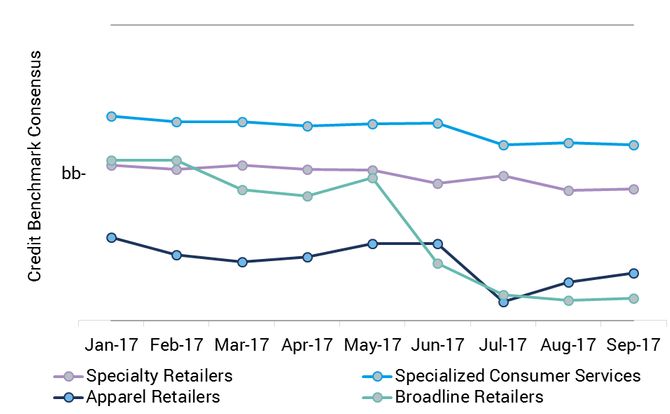
Exhibit 3.4 shows that all of the General Retail segments have been deteriorating. Specialized Consumer Services and Specialty Retailers show a moderate decline. Apparel Retailers showed the highest credit risk at the start of 2017 by a considerable margin, but Broadline Retailers have now overtaken them.
It is worth noting that the US Retail sector is probably more exposed to the underperforming Apparel and Broadline segments; this will contribute to the overall decline noted in Exhibit 2.2.1.
The steep decline in Apparel and Broadline Retailers credit quality is in line with the IHL group finding about the segments under stress – Broadline Retailers include some of the main department stores like Sears, Dillard’s, Macy’s and Kohl’s and the credit risk in this sector has risen by 29% since the beginning of the year.
Exhibit 3.7 shows the time series of the percentage of entities with deteriorating or improving credit quality by sector.
Exhibit 3.7 Credit Quality Improvement and Deterioration by Segments
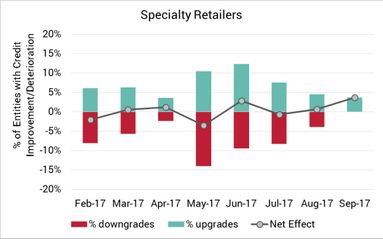
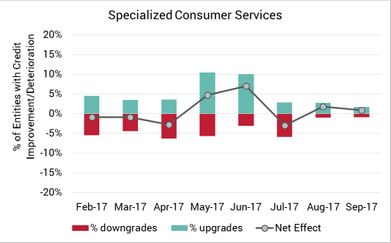
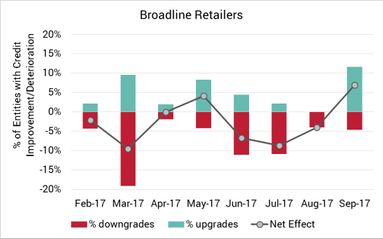

This shows that the net effect was close to being balanced over the 9 month period for Specialty Retailers and Specialized Consumer Services. Apparel Retailers had a difficult Q2 but appear to be more balanced in recent months. In Broadline Retail, entities with deteriorating credit quality outnumbered entities with improving credit quality in six out of the eight observed months.
Online shopping is growing, representing more than 30% of the retail sales growth over the last year. The average annual growth rate of e-commerce sales over 2011-2017 is close to 15%, while traditional retail grows by 3% per year.12 But the share of e-commerce in retail sales overall is currently only 9% (albeit up from 5% in 2011).
The online effect can be seen in the recent Black Friday sales. Footfall in US stores on Thanksgiving and Black Friday was down 4% on last year,13 while online sales increased by 18%. 14 Generally, the clear winner of rising online sales is Amazon; its online revenue was $95bn in 2016, representing almost one quarter of all e-commerce sales.
“Clicks and Mortar” is another expanding segment. The top 50 US e-commerce retailers include eight department stores, with online sales standing at $16.4bn. For four of these stores, e-commerce represents more than 15% of their total revenues and exceeds 5% for the rest. However, according to HRC Advisors this concept is less profitable for department stores than in-store sales. They estimate that e-commerce variable costs reduce department store profits by over 20%.
The department store sector is analyzed in more detail in the next section.
IHL Group report that discount stores are opening more stores than they are closing, while department stores struggle and their net difference of opens and closures is negative. Discount and convenience stores dominate the list of store openings with Aldi and Lidl expanding to the US from Europe.
Exhibit 3.1.1 shows credit risk for seven discount stores and seven department stores. In this graph, the larger bubbles indicates two companies with the same rating.
Exhibit 3.1.1 Credit Risk of Discount Stores vs Department Stores15
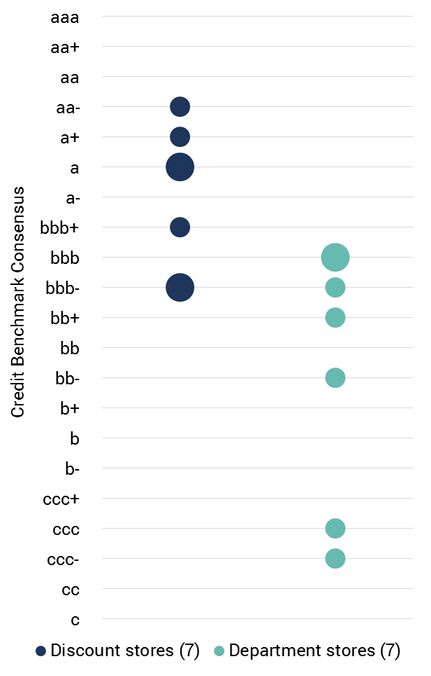
This shows that the credit quality of department stores is much lower compared to the credit quality of discount stores. All of the discount stores are in the investment grade category, while five of the seven department stores are considered non-investment grade.
Credit Benchmark (“CB”) is currently working with contributing banks to develop a new service for benchmarking and monitoring their credit portfolios. The Credit Benchmark Portfolio Monitoring report allows clients to:
Bank A has submitted a portfolio of 200 US Retailers to CB along with historical data on the creditworthiness of the entities. Bank A wants to learn three things about their US Retailer Portfolio:
Exhibit 4.1 Credit Evolution: US Retailers Portfolio of Bank A vs CB US Retailers Index
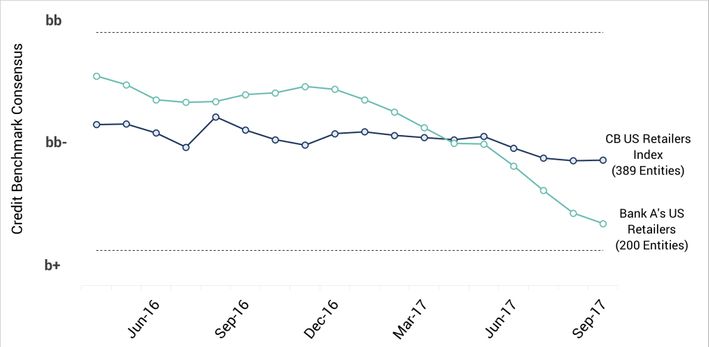
In Exhibit 4.1, the consensus credit quality (represented by the green line) of Bank A’s portfolio has declined from 2016 through 2017. This consensus view on the portfolio includes credit data from Bank A alongside the credit data from other banks participating in the CB service.
Also on Exhibit 4.1 is the historical credit quality of the CB US Retailers Index (dark blue). 16 Compared to the US Retail Portfolio of Bank A, the CB US Retail Index has deteriorated less over the last two years. This indicates that the US Retail portfolio of Bank A is deteriorating faster than the broader US Retail market. Because both trends are formed using all IRB and CCAR-regulated banks’ credit opinions, the reason for this faster deterioration can be largely attributed to the counterparty selection of Bank A
Exhibit 4.2 Bank A’s US Retailers: Bank A’s Credit View vs IRB and CCAR Bank’s Credit View (Excluding Bank A)
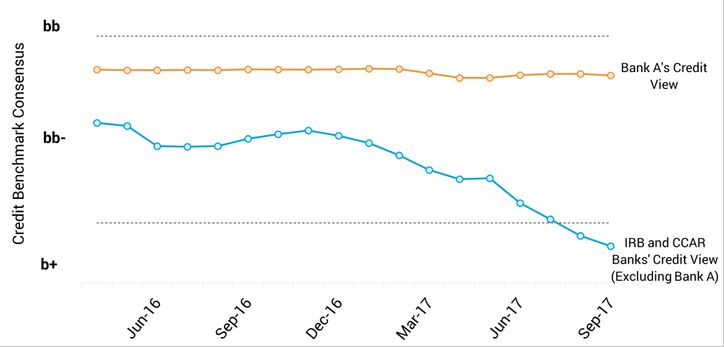
Exhibit 4.2 compares credit view of Bank A on their US Retail Portfolio with views of other IRB and CCAR-regulated banks. The orange line charted above represents the credit view of Bank A only; this shows that Bank A views the credit quality of their US Retail Portfolio to be stable over the last two years. However, the other IRB and CCAR-regulated banks (represented by the blue line) report that the credit quality of Bank A’s portfolio has deteriorated from 2016 through 2017. Because the two trends are looking at the same list of names, the trend difference highlights differences between internal credit opinions of Bank A and the other IRB and CCAR-regulated banks.
In addition to answering the three questions about Bank A’s US Retail portfolio at an aggregate level, Credit Benchmark can help Bank A further analyze portfolio differences at the segment and entity level.
Exhibit 4.3 Distance of Bank A’s Credit View vs IRB and CCAR Bank’s Credit View at the Segment Level
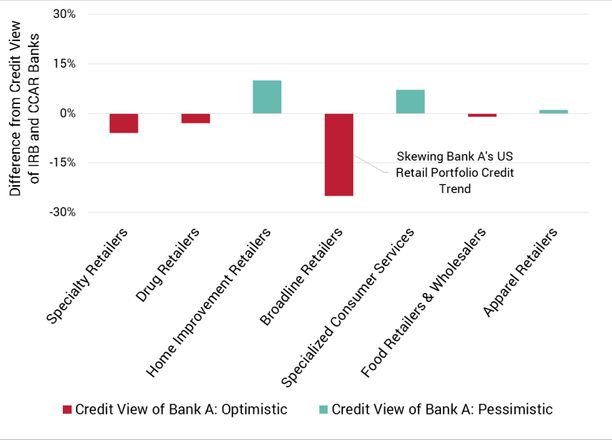
The Exhibit 4.3 shows that Bank A’s view of credit worthiness is very similar to other IRB and CCAR-regulated banks; with the exception of Broadline Retailers where Bank A has a more optimistic view (higher credit rating) on the names within this segment as compared to the peer banks. The difference for Broadline Retailers could have emerged as the other IRB and CCAR-regulated banks downgraded the segment with Bank A’s credit view either remaining the same or improving for the same group of entities.
Exhibit 4.4 Distance of Bank A’s Credit View vs IRB and CCAR Bank’s Credit View at the Entity Level
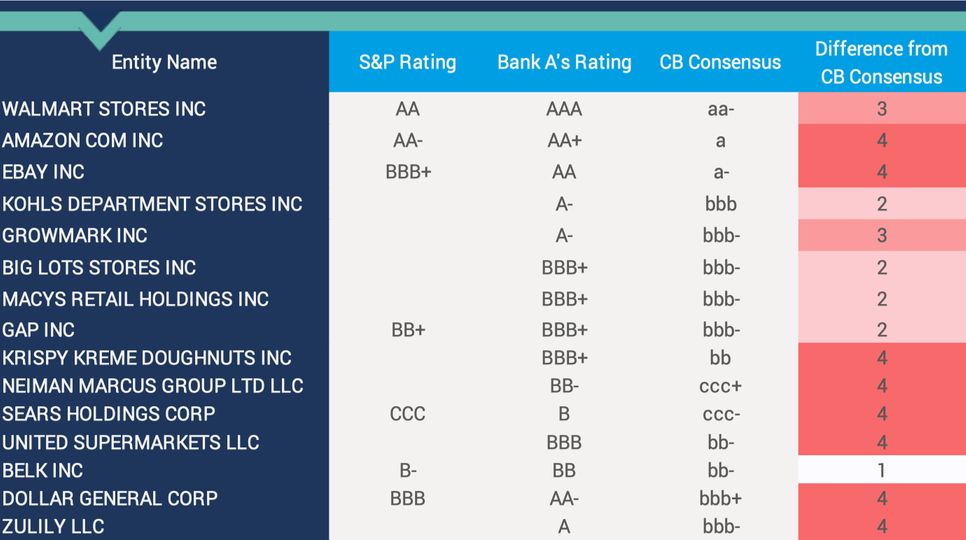
Exhibit 4.4, further refines the analysis to highlight specific entities where Bank A’s credit view is more optimistic than the view of other IRB and CCAR-regulated banks. In this case, Bank A’s credit view is more favorable than the view of the peer banks across all 15 of Bank A’s US Broadline Retail names. The entity level analysis is available for all contributing banks where Credit Benchmark has at least two other risk estimates contributed by the other IRB and CCAR-regulated banks.
The Credit Benchmark service provides clients with the ability to compare how a select portfolio, in this case US Retail names, has evolved compared to the broader market and the other IRB and CCAR-regulated banks participating in the CB service. This type of analysis provides a unique way of understanding counterparty selection and rating accuracy.
There is no doubt that traditional US Retailers are facing a number of difficulties. Some of their issues are shared in other Western economies, but they are particularly acute in the US. Over-expansion and heavy debt burdens accumulated during an extended period of low interest rates have left some of them vulnerable to competitive pressures from pure e-commerce companies as well as from newly entrant discount stores.
This is reflected in bank-sourced credit data; the consensus rating for US Retailers is noticeably lower than for those in Western Europe and all segments have shown recent declines. The Broadline and Apparel segments show the largest decline in credit quality.
But the global outlook for retail looks healthy, especially in developing economies. And many of the traditional retailers are finding ways to adapt – the “Clicks and Mortar” model, improved physical retail experiences, partnerships with pure e-commerce, and the growing demand for niche, specialty retailers.
A recent report by IHL group summarizes the position:
“Despite the headwinds and the negative headlines, retail as a whole is quite healthy. Retail Sales are up $121.5b through the first 7 months of 2017. To put that growth into perspective, that is about the size of the annual retail trade for the Netherlands….It is obvious that some of online retail’s strengths fit with the categories that are shrinking in sales in bricks and mortar stores. At the same time, much of the consumer products that drive the bulk of online sales are in categories that are also growing quite well at the store level. Which brings us to the statement that it’s all retail, and those that focus on the customer experience in retail will succeed and those who refuse to change will be in trouble going forward.”
– Debunking the Retail Apocalypse, IHL Group
This report has also presented an extended case study, showing some examples of the type of peer group benchmarking which is available to Credit Portfolio Managers in banks which contribute to the Credit Benchmark dataset.
Mahim Mehra: [email protected]
Michael Crumpler: [email protected]
Werner de Wit: [email protected]
Apparel Retailers
ALEX & ANI LLC
AMERICAN EAGLE OUTFITTERS INC
ARDEN ELIZABETH INC
ASCENA RETAIL GROUP INC
AVON INTERNATIONAL OPERATIONS INC
BROOKS BROS GROUP INC
CARTER WILLIAM CO
COLUMBIA SPORTSWEAR CO
ESTEE LAUDER INC
FOOT LOCKER INC
FOREVER 21 INC
G III LEATHER FASHIONS INC
GENESCO INC
J CREW GROUP INC
KORS MICHAEL USA INC
L BRANDS INC
LAUREN RALPH CORP
MENS WEARHOUSE INC
TALBOTS INC
TIFFANY & CO
TIFFANY & CO CANADA
TJX COS INC
TOO FACED COSMETICS LLC
UNIFIRST CORP
Broadline Retailers
AMAZON COM INC
BELK INC*
BIG LOTS STORES INC*
COSTCO WHOLESALE CORP*
CST BRANDS INC
DILLARDS INC*
DOLLAR GENERAL CORP*
DOLLAR TREE INC*
EBAY INC
FAMILY DOLLAR STORES INC
GAP INC
GROWMARK INC
HSN INC
KOHLS CORP*
KOHLS DEPARTMENT STORES INC
KRISPY KREME DOUGHNUTS INC
LANDS END INC
LORD & TAYLOR ACQUISITION INC
MACYS INC*
MACYS RETAIL HOLDINGS INC
MEIJER INC
NEIMAN MARCUS GROUP LTD LLC*
NORDSTROM INC*
PRICELINE GROUP INC
RODAN & FIELDS LLC
ROSS STORES INC*
SEARS HOLDINGS CORP*
SHUTTERFLY INC
STAPLES INC
TARGET CORP*
UNITED SUPERMARKETS LLC
VINEYARD VINES LLC
WALMART STORES INC*
ZULILY LLC
Specialty Retailers
ACETO CORP
ACUITY BRANDS INC
ADMI CORP
ADVANCE STORES CO INC
AMNEAL PHARMACEUTICALS LLC
AUTONATION INC
BARNES & NOBLE INC
BEST BUY CO INC
BROOKS AUTOMATION INC
BUILDERS FIRSTSOURCE INC
CARMAX AUTO SUPERSTORES INC
CLOROX CO COACH INC
COMMUNICATIONS TEST DESIGN INC
DAKTRONICS INC
ERAC USA FINANCE LLC
ESTEE LAUDER COS INC
GAMESTOP CORP
GENERAL NUTRITION CENTERS INC
GLUCK E CORP
GROUP 1 AUTOMOTIVE INC
HAWORTH INC
HOFFMANN LA ROCHE INC
IMMUCOR INC
INTERFACE INC
ITRON INC, WA
JORDACHE ENTERPRISES INC
KAR AUCTION SERVICES INC
LIFETIME BRANDS INC
LITHIA MOTORS INC
MCCORMICK & CO INC
MCJUNKIN RED MAN CORP
Home Improvement Retailers
BED BATH & BEYOND INC
HOME DEPOT INC
LOWES COS INC
Specialized Consumer Services
ADVANCE AUTO PARTS INC
ALEXANDER PROUDFOOT CO
ALSCO INC ANALOGIC CORP
BLACK & VEATCH HOLDING CO
BOSTON CONSULTING GROUP INC
BRIGHT HORIZONS FAMILY SOLUTIONS LLC
BROADRIDGE FINANCIAL SOLUTIONS INC
CARDTRONICS INC
CARDTRONICS USA INC
CAREERBUILDER LLC
CDM SMITH INC
CHENEGA CORP
COVANCE INC
DAYMON WORLDWIDE INC DELOITTE LLP, NY
DUKE ENDOWMENT EBAY PARTNER NETWORK INC
EHI INTERNATIONAL FINANCE SARL
EMERALD EXPOSITIONS HOLDING INC
ERAC IRELAND LTD
HDR INC
HEICO COS LLC
HEIDRICK & STRUGGLES INTERNATIONAL INC
HOTELBEDS USA INC
HUNTON & WILLIAMS LLP
INVENTIV HEALTH INC
LEGALZOOM COM INC
LOCKE LORD LLP
MARCUM LLP
MARITZ HOLDINGS INC
MATTHEWS INTERNATIONAL CORP
NIELSEN HOLDINGS PLC
PAE HOLDING CORP
RPX CORP
SAPIENT CORP
SERVICE CORP INTERNATIONAL
SERVICEMASTER CO LLC
SNAP ON INC
SOTHEBYS INC
TEMPLETON JOHN FOUNDATION
TOWERS WATSON DELAWARE INC
VICAR OPERATING INC
WEIGHT WATCHERS INTERNATIONAL INC
WHEELS INC
WILLIS TOWERS WATSON PLC
Specialty Retailers
MICHAELS STORES INC
NEIMAN MARCUS GROUP INC
NISSAN NORTH AMERICA INC
OFFICE DEPOT INC
OWENS CORNING
OWENS CORNING SALES LLC
PARTY CITY HOLDINGS INC
PETCO ANIMAL SUPPLIES INC
PETROLEUM WHOLESALE LP
PETSMART INC
PEYSER DAVID SPORTSWEAR INC
PILOT TRAVEL CENTERS LLC
PRESTIGE BRANDS HOLDINGS INC
PRICESMART INC
QVC INC
RADIO SYSTEMS CORP
RESMED INC
RESTORATION HARDWARE INC
ROGERS CORP
SA RECYCLING LLC
SCHINDLER ELEVATOR CORP
SENSIENT TECHNOLOGIES CORP
SONIC AUTOMOTIVE INC
STRAUSS LEVI INTERNATIONAL INC
TECHNIC INC
TI GROUP AUTOMOTIVE SYSTEMS LLC
TOYOTA MOTOR SALES USA INC
VISHAY INTERTECHNOLOGY INC
VOXX INTERNATIONAL CORP
WARNER MUSIC GROUP CORP
YAMAHA MOTOR CORP USA
YURMAN DAVID ENTERPRISES LLC
Download the article “Retail Industry Trends” on PDF.
We aggregate the views of thousands of institutional credit analysts to create new, unique consensus data and analytics. Our clients use the unique entity- and aggregate-level data and analytics to understand and manage their risks effectively. The data helps clients focus their attention on where and when it matters most, whether in their risk management, investment process, or regulatory compliance. Learn more.
Barbora Makova
Jacob Hibbert
Delia Nunez
1 Theresa Agovino. ”Property Investors Bet on Emerging-Market Mall Culture.” The Wall Street Journal 3 Oct. 2017. Web. 29 Nov. 2017 https://www.wsj.com/articles/property-investors-bet-on-emerging-market-mall-culture-1507028403
2 Based on Probability of Default estimates from three or more contributing banks.
3 The ‘Wisdom of Crowds’ was initially observed by Francis Galton and is the basis for the value in crowdsourced datasets. It is the popular version of the Diversity Prediction Theorem which can be stated as: “The squared error of the collective prediction equals the average squared error minus the predictive diversity” – implying that if the diversity in a group is large, the error of the crowd is small.
4 The Credit Benchmark Consensus (“CBC”) is a 21-category scale explicitly linked to probability of default estimates sourced from major banks. A CBC of bbb+ is broadly comparable with BBB+ from S&P and Fitch or Baa1 from Moody’s.
5 Quorate entities have observations from three and more banks, semi-quorate entities are entities with observations from two banks.
6 Austria, Belgium, Denmark, Finland, France, Germany, Ireland, Italy, Netherlands, Norway, Portugal, Spain, Sweden, and Switzerland
7 IHL Group – Debunking The Retail Apocalypse (August 2017)
8 VISA – Visa’s UK Consumer Spending Index, Compiled by IHS Markit on behalf of Visa (November 2017)
9 Yoni Van Looveren. ” Zalando grows more than 25 % in third quarter.” Retail Detail 7 Nov. 2017. Web. 29 Nov. 2017 https://www.retaildetail.eu/en/news/fashion/zalando-grows-more-25-third-quarter
10 US Census Bureau
11 US Census Bureau
12 US Census Bureau
13 RetailNext Inc
14 Adobe Systems Inc.
15 The entities used in Exhibit 3.1.1 are marked by a star in Appendix 2.
16 The US Retail Index is constructed using Credit Benchmark Index Methodology as discussed in White Paper “Bank-Sourced Credit Indices”, which is available on Credit Benchmark website.
Disclaimer: Credit Benchmark does not solicit any action based upon this report, which is not to be construed as an invitation to buy or sell any security or financial instrument. This report is not intended to provide personal investment advice and it does not take into account the investment objectives, financial situation and the particular needs of a particular person who may read this report.

